Last month, 369 single-family homes sold on the MLS® System compared to 400 in October 2014, a decrease of eight per cent. Month over month, sales were down by 14 per cent from September 2015. When condominium and townhouse sales are factored in, however, sales board wide increased by two per cent. Inventory levels continue to decrease, with active listings down 16 per cent from one year ago. We are carful not to paint the whole market with the same brush as some segments have seen an increase in inventory.
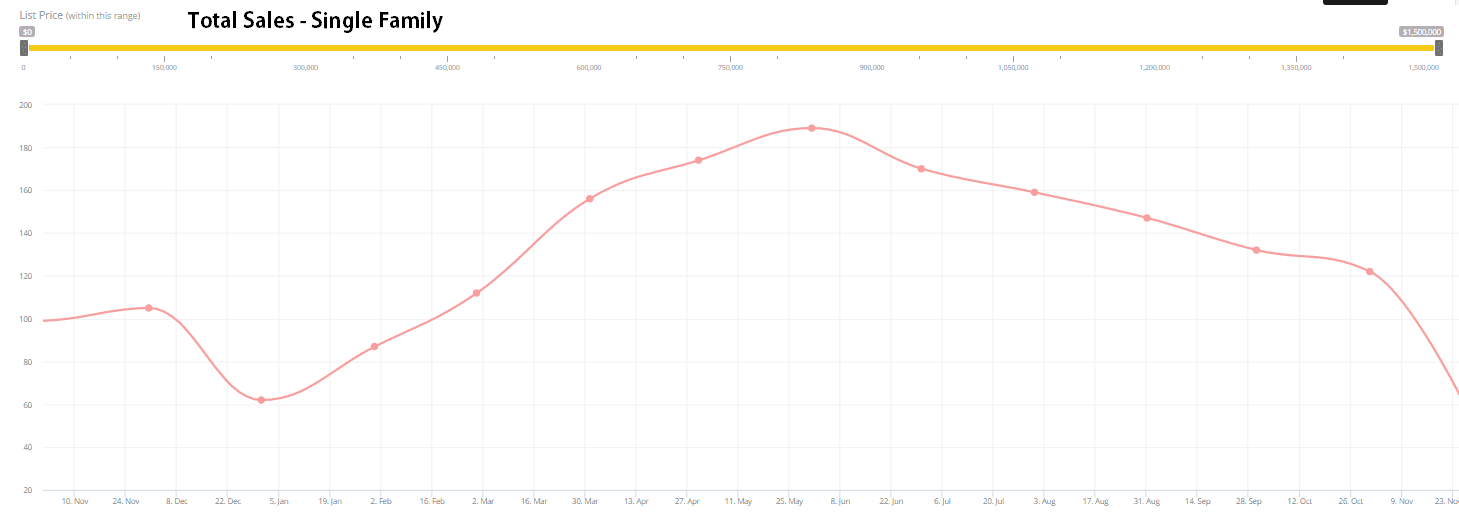
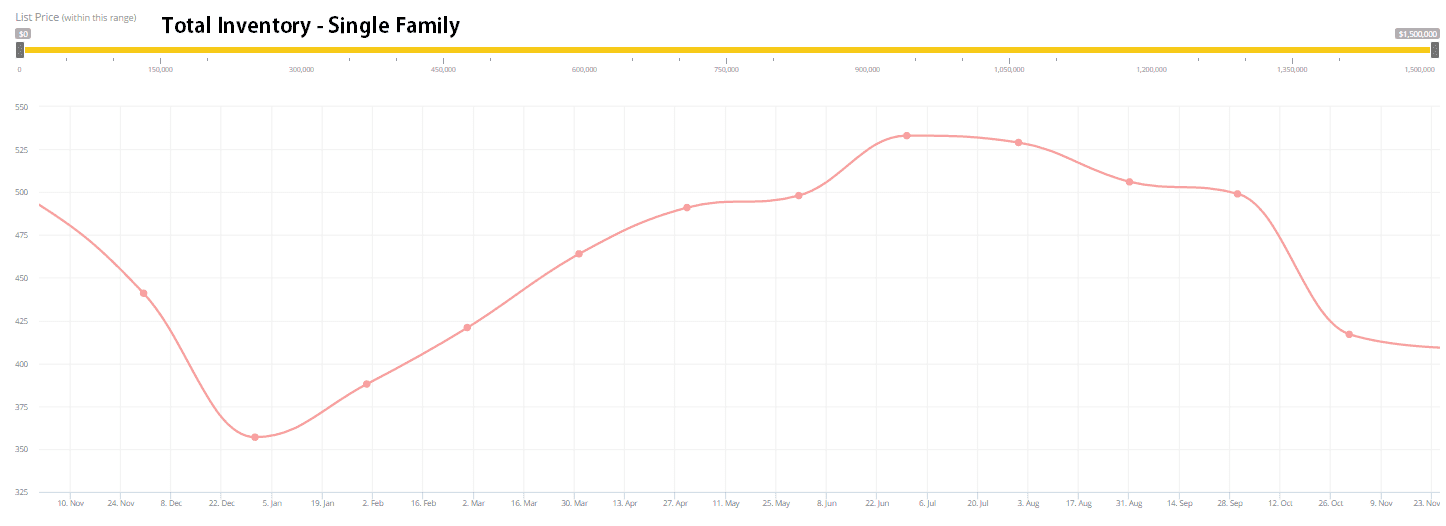
We find some interesting trends with 2 different markets immerging, the largest decrease in single family homes inventory is in the price range between 400K – 500K at 60% less today then the same time of the year in 2011. Interestingly enough, here’s where things start to shift creating the 2 different markets with active inventory between 600K – 800K showing an 18%-24% increase over 4 years ago.
In October 2015, the benchmark price for a single-family home in the VIREB coverage area was $339,100, a slight decrease from September and up 5.60 per cent from one year ago. The average MLS® price of a single-family home increased to $361,665 compared to $350,661 last month and $349,172 in October 2014.
Nanaimo total inventory graph for the past year.
Market intelligence is key to helping my clients stay ahead of the market and as the co-founder of trenlii analytics I am happy to be able to share some of the software features with 1000’s of other Realtors in Canada