
Nanaimo Real Estate Market Stats: First Look at June sales and the 90-Day Trend
Actionable Data, First June stats to Market—From Gillette & Associates.
If you’re searching for the most current Nanaimo real estate statistics and trends, you’re in the right place.
We break down the latest 90-day data for single family homes—providing the numbers and insights you need weeks before they appear in official market reports. Our analysis covers average price per square foot, hottest neighbourhoods, days on market, and the true impact of price drops. If you want to price your home right or buy with an edge, these are the numbers to know.
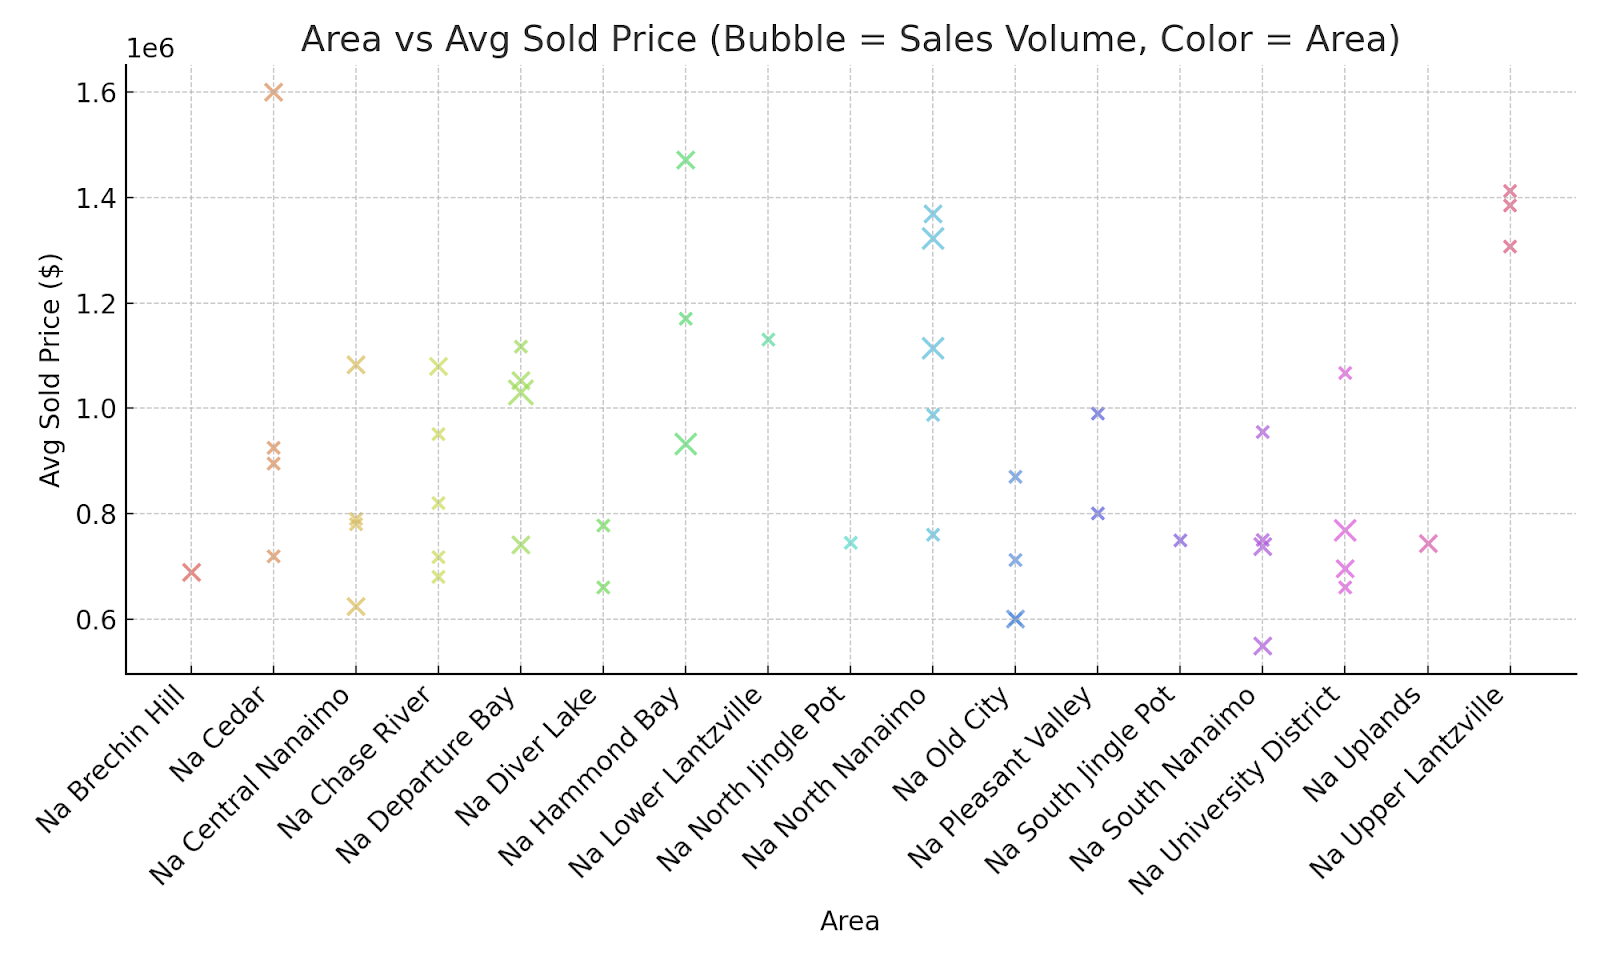
1. Nanaimo’s Most Active Areas—Where Homes Are Selling Now
The past three months saw the highest sales volumes in:
– North Nanaimo
– Departure Bay
– University District
– South Nanaimo
– These neighbourhoods continue to anchor the market, both for activity and for overall price performance.
2. Price Per Square Foot: Who’s Leading the Market?
When it comes to maximizing value, price per square foot is the key stat:
Central Nanaimo (an outlier this quarter due to two unique high-value sales) and South Nanaimo led in $/sqft, but this is not the long-term norm.
North Nanaimo remains the top performer in most periods and home types.
Takeaway:
If you’re selling in these areas, accurate pricing is crucial—buyers are watching $/sqft closely.
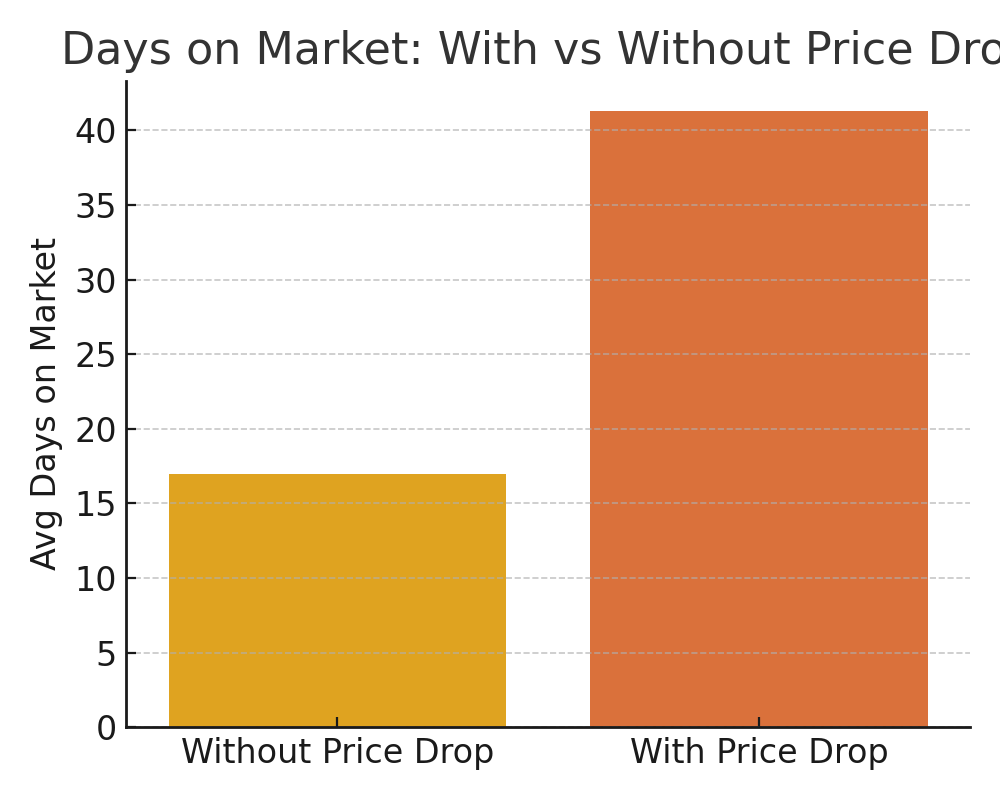
3. How Fast Are Homes Selling? (DOM and Market Velocity)
The average days on market for all sales this quarter:
All sales: 36 days
Homes sold without a price drop: 17 days
Homes that required a price reduction: 41 days
(Chart: Days on Market—With vs Without Price Drop)
4. Price Drops: Do They Work?
Over 75% of homes needed at least one price drop to sell.
But the data is clear—waiting and reducing the price later does not result in a higher price per sqft; in fact, those homes sold for slightly less, on average.
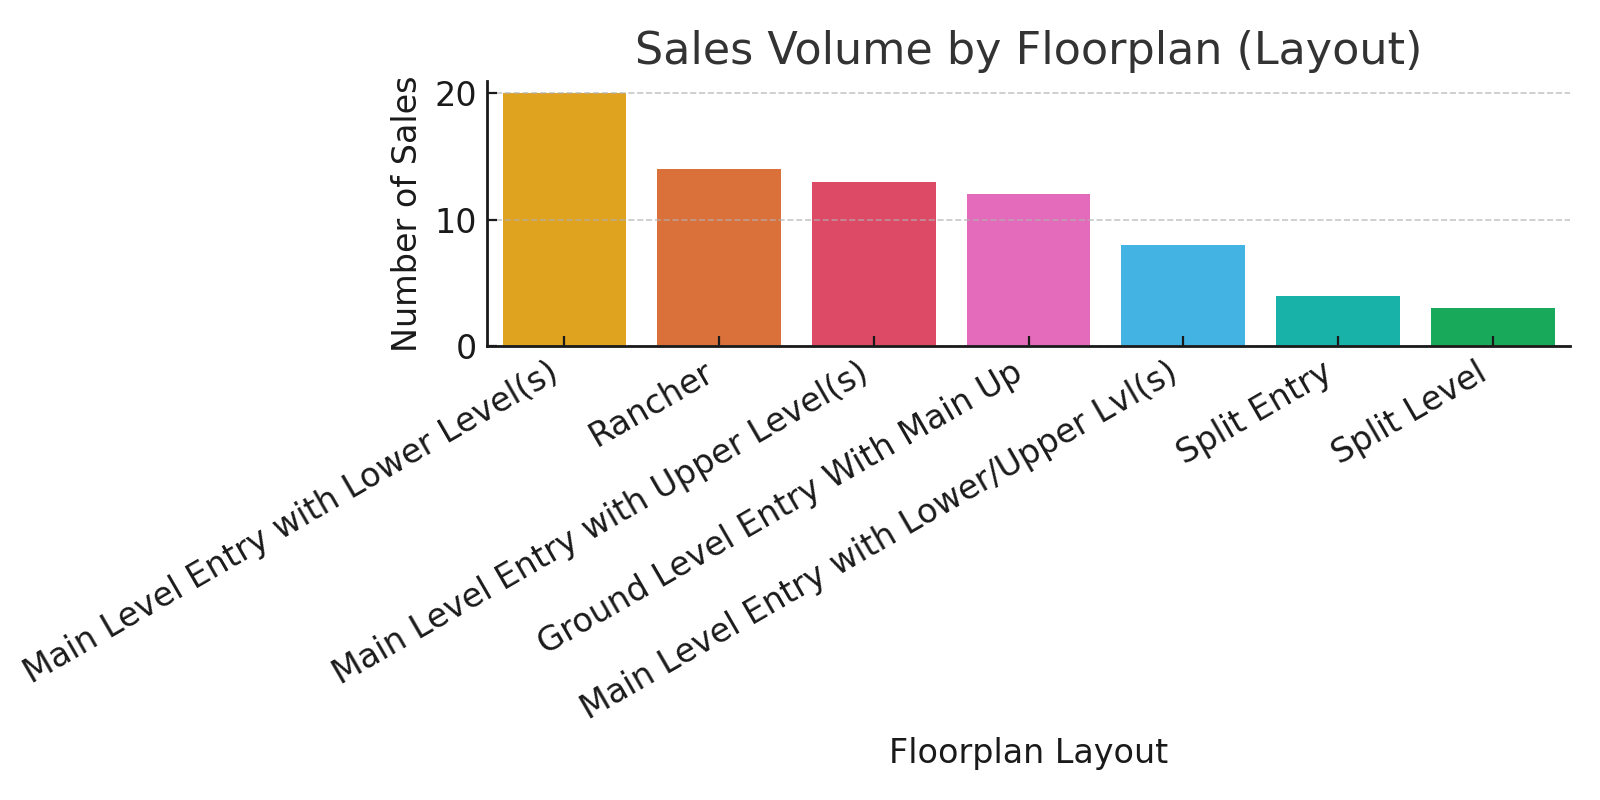
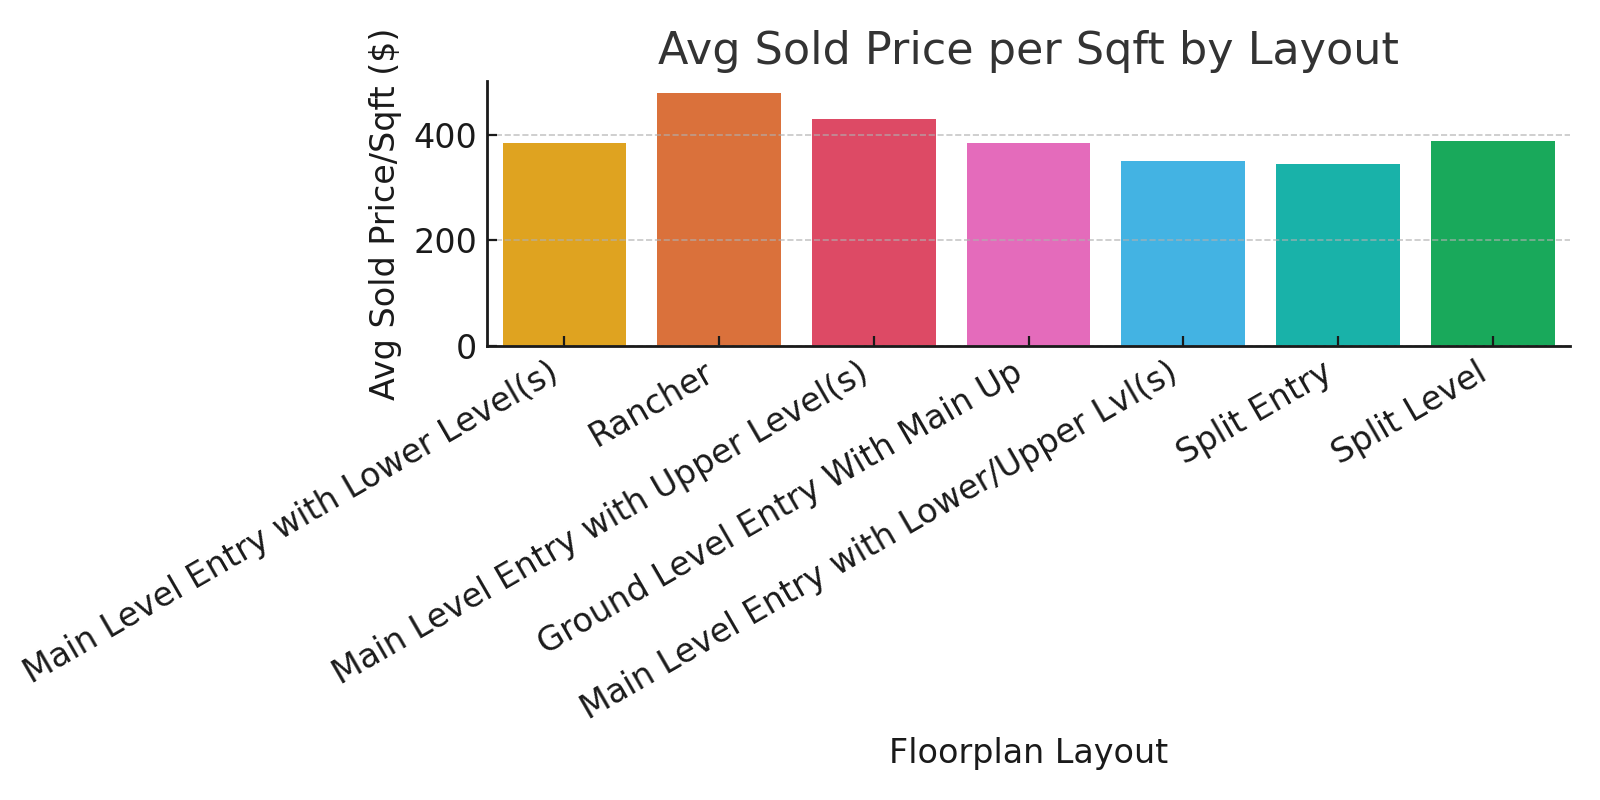
5. What About Home Styles and Floorplans?
While not the headline driver, home style (floorplan/layout) still plays a role in market value:
Ranchers consistently achieve the highest average sold price per sqft ($479/sqft) and show strong demand, especially among downsizers and retirees.
Main Level Entry with Lower Level(s) is the most common floorplan sold, appealing to families needing more space.
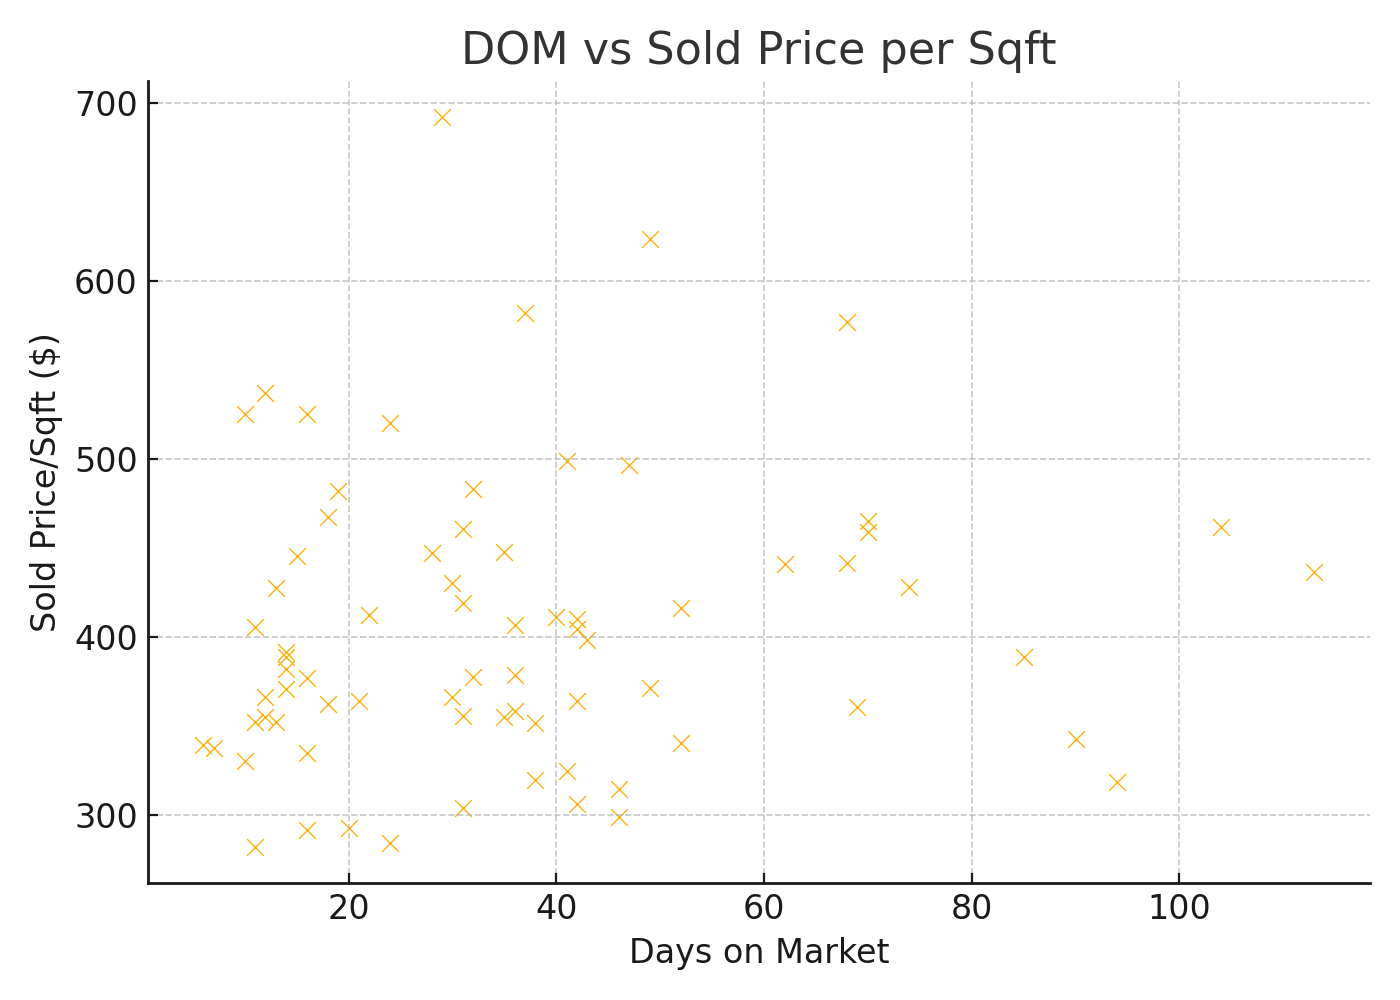
6. Are Price and Speed Connected?
Looking for the “sweet spot” between price and days on market? The data this quarter shows no significant correlation between price per sqft and speed of sale—well-priced, well-marketed homes can sell quickly at all price points.
(Chart: DOM vs Sold Price per Sqft)
7. Where Does Your Home or Target Buy Fit?
Whether you’re a seller or buyer, understanding hyper-local trends is key:
Certain neighbourhoods command premiums regardless of market cycle.
– Ranchers and accessible layouts are in steady demand.
– Pricing right from the start yields the best results—chasing the market with reductions typically leads to longer days and lower outcomes.
Key Market Takeaways: Nanaimo Real Estate Data First
North Nanaimo, Departure Bay, University District, and South Nanaimo are the most active areas.
Price per square foot is the most reliable metric for value—track it by area and home type, not just total price.
Fastest sales come from correct initial pricing, not late price reductions.
Floorplan matters, but location is still king.
Our data is your advantage:
Get ahead of the market with real-time stats and strategy from Gillette & Associates.
Want the latest numbers for your home or neighborhood?
Contact us for a custom data report and pricing strategy.
Please verify data and inquire for specific insights. Some listings and sales have been removed as outliers.
Thanks for stopping in to review the latest Nanaimo and Vancouver island real estate market Statistics by Nanaimo #1 Selling Realtor, 30+ Years, 1992-2025
Find more information on the market through our monthly blog.