
Months of Inventory
We have talked about this in previous Nanaimo real estate market updates, but with big changes in months of inventory coming into April, it is worth looking at again. The months of inventory is a measure of supply and demand over a given period. On the supply side, months of inventory takes into account all active listings plus new listings introduced to the market in that period. This means that listings that have been on the market for a longer time are factored into the market. Demand looks at the amount of transactions that happened in the same period of time and looks at the correlation between supply and demand to indicate market sustainability. This is also a factor that we use to determine the difference between a Buyer’s and Seller’s market.
A decrease in months of inventory can mean a few different things.
- Number of new listings introduced to the market over a period of time has decreased (Less supply).
- Number of sales over a given period increased (More demand).
- Number of new listings has decreased, and the number of sales increased simultaneously.
An increase in months of inventory would be the flipside to a decrease.
- Number of new listings introduced to the market over a period of time increased (More supply).
- Number of sales over a given period decreased (Less demand).
- Number of new listings increased, and number of sales decreased simultaneously.
One thing to keep in mind is that the months of inventory can be very sporadic if you look at it every single day. This is because some days we will have more new listings, typically in the middle/later in the week heading into the weekend, and other days where more listings sell and get removed from the market than get listed.
Heading into April, we saw a decrease in the months of inventory from 6.9 in the previous period to currently having 4.3 months of inventory.

A substantial change in months of inventory like this indicate that there is a bigger picture to look at to determine why we saw this decrease.
Month over month we saw a 37.25% increase in new listings introduced to the market. While an increase in inventory is promising, there was a 68.33% increase in the number of sales month over month from 60 sales in February to 101 sales in March. The disparity between supply and demand illustrates that while inventory did increase, demand increased by so much more that the additional inventory was still less than what was required to keep months of inventory from dropping. With less months of inventory this creates more scarcity in the Nanaimo real estate market, which brings us to the next market indicators, which provides us with insight into…
Buyer Behaviour
We’ve established that the average single family home price in Nanaimo decreased month over month, but now it’s time to look at why, in this instance, average price isn’t an indicator of a market decline. Looking at ratios in our market shows that more homes are selling in the month that they are listed, a decrease in the average days on market and an increase in the sell to list price.
Sell to List Ratio
This ratio tells us the percentage of homes that sold compared to how many were listed in a given period. When we look at this month over month we had an increase from 58.82% in February to 72.14%. So while we had an increase in new inventory month over month, the increase in transactions and demand equates to actually having less inventory for the amount of Buyers currently in the market. This demonstrates that an influx of Buyers has resulted in homes selling more quickly.

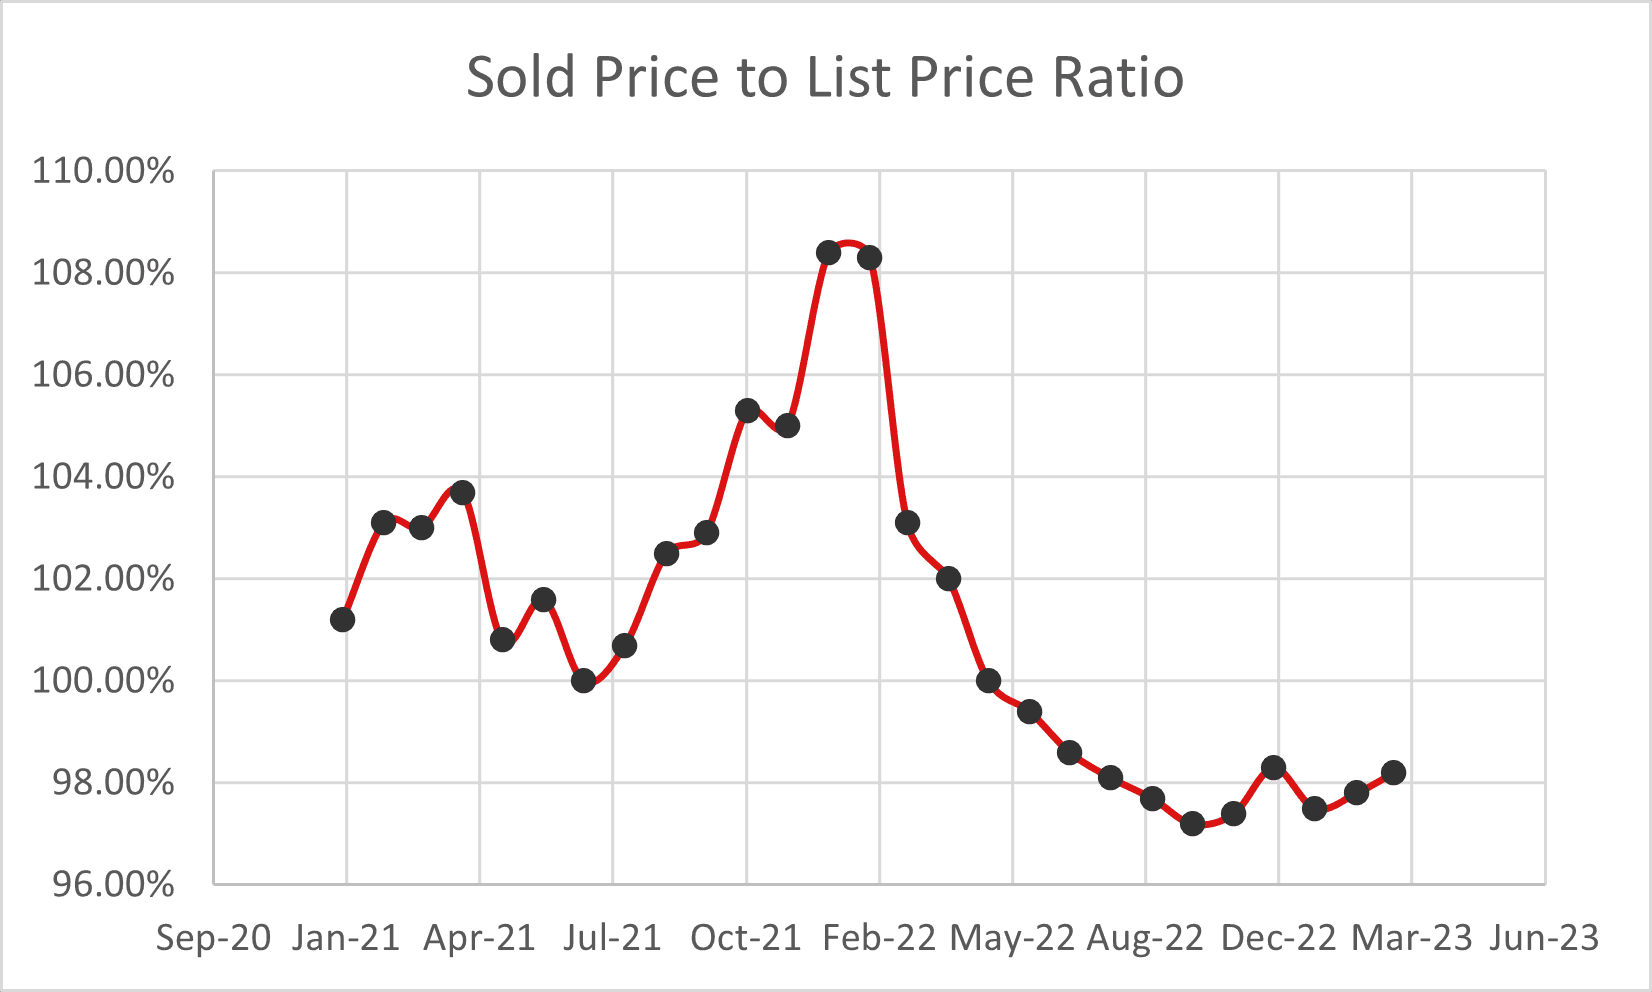
Sale to List Price Ratio
In addition to an increase in the number of transactions relative to new inventory, we also saw an increase to the sale to list price ratio. The sale to list price ratio shows on average how closely homes are selling to the list price on MLS. A year ago when we were still in that crazy pandemic market the sale to list price was 105.95%, meaning that on average homes were selling close to 6% above the listing price. Today we are still in a market where the sale to list ratio shows on average homes are selling for 98.63% of the asking price, which is an increase from the previous month.
What Does This All Mean?
Combining all of these factors it is safe to say that we are seeing more Buyers coming to the Nanaimo real estate market highly motivated. In some instances, this is bringing back the market where multiple offers on a property is more common, and that homes are selling within days of being listed. We are also in what we would consider a transitional market where there are some listings that get more attention than others based on perceived value so if there are 10 listings at a given price point and there are 2 or 3 that clearly offer a better value that Buyers are flocking more to those high demand properties creating a mix of sales that go over the asking price in multiple offers and homes that are on the market a little bit longer and selling for slightly under the asking price, which can also sometimes be in multiple offers.
While these multiple offer situations can create more stress and uncertainty for Buyers, it’s important to note that the majority of homes that we are seeing sell in multiple offer situations Buyers are still able to have subjects in their offers, such as financing and inspections, where a year ago many offers were subject free. Part of the change here is that Buyers saw what happened in the previous market and have an understanding of the importance of having due diligence.
Where Could We Be Headed?
Of course, no one has a crystal ball that can say where the market is headed with absolute certainty, but looking at the numbers, if things continue the same way as this past month, we are going to see the gap between sale to list price ratio become smaller, days on market decrease even further and less homes available on the market. As a result of this, we could also see the average home price start to increase again.
Aside from the qualitative statistics, there are also quantitative measures that will have an impact on the direction of the market. Historically, spring sees a boost in the market compared to winter so the market does tend to get busier at this time of year. Interest rates will also play a role in how the market shifts. In our conversations with Buyers and Sellers since the beginning of the year there has been a mix of people that are moving regardless of what interest rates do, people waiting for rates to hold (which happened in March), and people that are waiting for rates to start to decrease.
How do I Navigate Through This Market?
Sellers
As the market heats back up, it’s safe to say that there is demand for your home. If you are thinking that selling your home is a possibility within the next 6 months, now is the time to reach out to us for a no obligation home valuation so that you have an idea of where you sit in the market.
Buyers
Seeing homes that you have interest in as soon as they come on the market is going to be more important than ever. It’s important to have someone working with you to make sure that you aren’t missing any homes that fit your criteria so that you are seeing them the day they list and booking showings on the ones that you think are the right one for your family. Working with our network of clients and professional network, we also try to get leads on homes before they even hit the market to give our clients a competitive edge. It is also very important to have a solid offer strategy as there are factors other than price that we can leverage in negotiations.