
Nanaimo Real Estate Market Insights: 30-Day Deep Dive Ahead of Official Stats
Welcome to the August 2025 Market Update. If you’re watching Nanaimo’s housing market, you know it’s shifting beneath our feet—but what’s really happening right now? Before the official boards release their monthly figures, this deep-dive blog post gives you:
Real-time intelligence on inventory, velocity, and price thresholds
Visual breakdowns of where demand is strongest
Neighbourhood rankings for listings and sales
Actionable takeaways whether you’re buying, selling, or investing
Data Overview
Time Window: July 1 – July 31, 2025
Scope: All active, pending, and sold listings in Nanaimo
Key Metrics:
Months of Inventory (MOI) by price band
Average Days on Market (DOM) for actives vs. sales
Top 5 sub-areas for new listings and closed sales
1. Price-Band Inventory Pressure
Figure 1: Nanaimo’s 30-day MOI across price bands from <$500 k to $1.5 M+
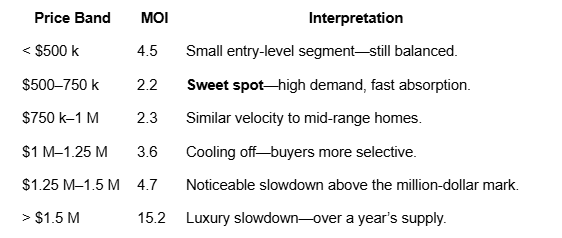
Insight: Homes priced between $500 k and $1 M move fastest. Above $1 M, inventory piles up—especially in the $1.5 M+ luxury bracket.
2. Market Velocity: How Fast Are Homes Selling?
Figure 2: Average DOM for active listings vs. properties that sold.
Active Listings: 53.8 days on market (average)
Recent Sales: 32.7 days on market
Insight: Properly priced and marketed homes sell nearly 20 days faster than the overall active pool, underscoring the importance of realistic list pricing.
3. Nanaimo’s Hottest Neighbourhoods
Top 5 Areas by New Listings
North Nanaimo – 43 listings
South Nanaimo – 23
University District – 21
Hammond Bay – 15
Uplands – 14
Top 5 Areas by Closed Sales
North Nanaimo – 30 sales
South Nanaimo – 18
Hammond Bay – 12
Departure Bay – 12
Central Nanaimo – 10
Insight: North Nanaimo leads both supply and demand—ideal for agents to target and for buyers to monitor closely.
4. What This Means for Buyers & Sellers
Sellers:
$500 k–$1 M Band: Price competitively, stage impeccably, and expect multiple offers.
$1 M+ Segment: Leverage targeted marketing (video tours, lifestyle branding) and consider small incentives to stand out.
Buyers:
Core Market ($500 k–$1 M): Move fast—homes here don’t last.
Luxury Searchers ($1 M+): Enjoy more negotiating leverage and deeper inventory.
Investors & Flippers:
University District & South Nanaimo: Consistent turnover suggests rental demand and flip potential.
Hammond & Departure Bay: Lifestyle-oriented pockets, attracting premium niche buyers.
5. Wrap-Up & What’s Next
Before you go, here’s a quick look at complementary reports and upcoming coverage to round out your market intelligence:
Luxury Market Report by Chris Sinclair
Chris’s monthly luxury snapshot drills into trophy homes, waterfront estates, and high-end developments on Vancouver Island. His analysis on price trends and buyer profiles in the $1.5 M+ bracket is essential reading if you’re in the upper-tier market.
South Nanaimo Deep Dive by Chris Rigby
Chris Rigby’s report focuses exclusively on South Nanaimo’s evolving neighbourhoods, new-build opportunities, and demographic shifts. If you’re targeting that area—whether as a buyer or seller—his data on sub-area price benchmarks and days on market will give you an edge.
Live Interview on Our Deep-Dive Radio Show
I’ll be sitting down with both Chris Sinclair and Chris Rigby on August 5 for our radio deep-dive series. We’ll compare notes, answer listener questions, and unpack the strategies you can use right now—so tune in!
Next Up: Canada-Wide Market & Macroeconomic Trends
In early August, we’ll publish a national real estate overview as the latest CREA and StatCan numbers roll in. We’ll examine:
Canada’s Unemployment Rate: Currently hovering around 7.0%, still above pre-pandemic norms but showing gradual improvement.
Bank of Canada Rate Decision: At its July 30 meeting, the Bank of Canada held its benchmark interest rate unchanged at 2.75% in its July 2025 decision, as expected by markets, to mark the third hold following 2.25 percentage points of cuts throughout seven consecutive decisions.
The annual inflation rate in Canada rose to 1.9% in June of 2025 from 1.7% in the previous month, aligned with market expectations. Despite the pickup, the rate remained below the Bank of Canada’s mid-point target of 2% for the third straight month, consistent with the central bank’s forecast that price growth should rise as tariffs and supply-disruptions may threaten material shortages.

Stay Ahead of the Curve
Bookmark this blog and subscribe to our newsletter—because by the time the official board stats hit next week, you’ll already know how to interpret them, what they mean for your property goals, and where to focus your next move.
— Derek Gillette, REALTOR® with 30+ years on Vancouver Island. Committed to helping you understand the why behind every housing metric—and turning data into decisions.