Gillette and Associates 2024 Market Recap & 2025 Outlook: Navigating the Road Ahead
As a leading real estate team with deep roots and extensive experience in the local market, we are thrilled to share our expert analysis of the housing landscape and offer our informed predictions for 2025.
Factors we are watching in 2025
1. Bank of Canada Monetary Policy:
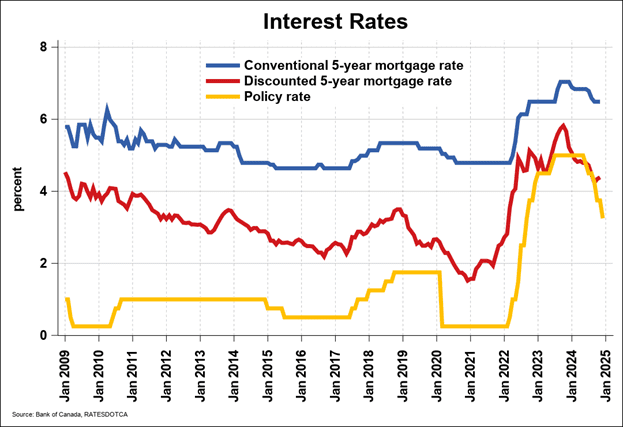
– Interest Rate Cuts: Timing and magnitude will be crucial. Faster and larger cuts will stimulate the market; slower, smaller cuts will prolong the slowdown.
– Inflation: Will the BoC achieve its inflation targets? Persistent inflation could force them to keep rates higher for longer.
2. Economic Indicators:
– GDP Growth: A strong economy generally supports the housing market. A recession would negatively impact buyer confidence and affordability.
– Unemployment Rate: Job security is closely tied to housing demand. Rising unemployment would dampen the market.
– Consumer Confidence: This psychological factor reflects how Canadians feel about the economy and their financial prospects. High confidence can lead to increased housing activity.
3. Housing Supply and Construction:
– New Housing Starts: Will construction ramp up enough to meet long-term demand?
– Government Initiatives: Policies aimed at boosting housing supply (e.g., zoning reforms, incentives for developers) could have an impact, though their effects may take time to materialize.
– Immigration: Canada’s high immigration targets will continue to drive housing demand, particularly in major cities.
4. Affordability:
– Price-to-Income Ratios: This metric reflects how affordable housing is relative to average incomes.
– Rental Market: Trends in the rental market can influence the buying market. High rents can push more people toward buying if they can afford it.
– Mortgage Stress Test: The qualifying rate for uninsured mortgages is still quite a bit higher than the interest rate offered, any changes to this could have a significant impact on market affordability.
2024: Was A Year of Stability and Balanced Opportunity on Vancouver Island
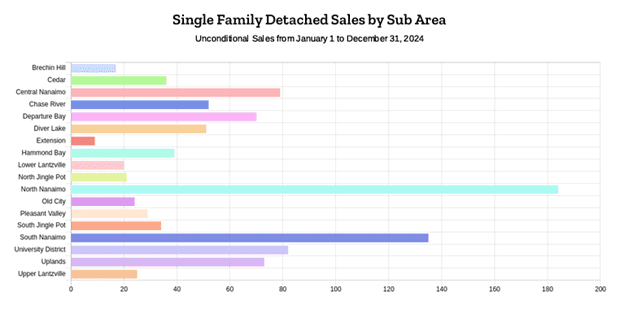
In Nanaimo the most active area is still North Nanaimo.
The year concluded on a steady note, with 7,489 properties sold across all categories. This figure represents a slight increase from 2023’s 7,297 sales, though slightly below 2022’s total of 7,810. December, in particular, demonstrated resilience with 443 properties sold and 2,883 active listings.
Year Total Sales
2022 = 7,810
2023 = 7,297
Current = 7,489
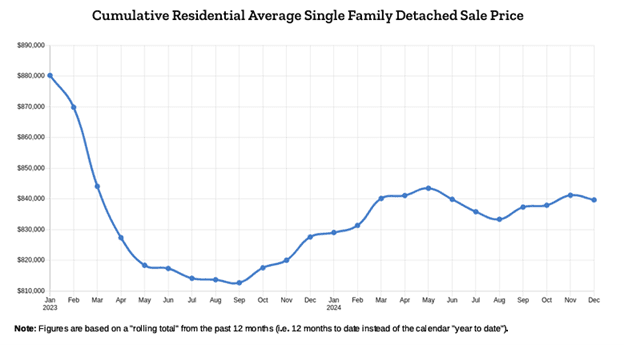
Nanaimo Average price
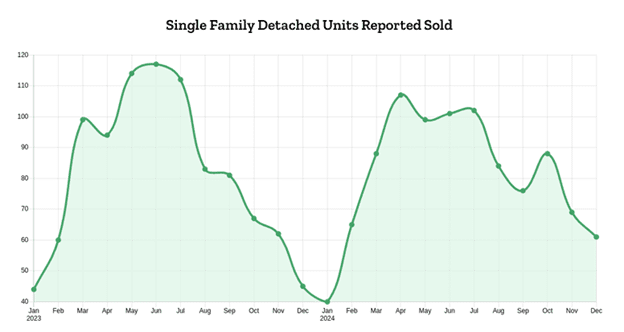
Nanaimo Sales Volume
Key Trends We Observed: Vancouver Island Real Estate Market – December Highlights
1. Single-Family Homes: Still the Star
– The Big Picture: Single-family homes (excluding acreage and waterfront) were the top performers in December.
– Year-Over-Year: Sales jumped a whopping 52% compared to last December! This shows these homes are still very popular.
– Month-to-Month: But, sales were down 15% compared to November. A small dip, but overall, this segment is doing great.
2. Condos and Townhomes: Mixed Results
– Condo Sales: 44 condos sold in December.
– Up 16% from last December.
– Down 29% from November.
– Townhouse Sales: 58 townhouses sold in December.
– Up 49% from last December.
– Down 24% from November.
3. Inventory: Staying Balanced
– Overall: The number of homes for sale (inventory) stayed pretty balanced across different property types.
– Single-Family Homes: 829 listings in December, a small increase from 796 last year.
– Condo Apartments: 271 listings, slightly up from 257 in December 2023.
– Townhouses: 195 listings, down from 244 last year.
4. Prices: Small Changes
– Single-Family Homes: The average price across the board area was $776,500 in December, up 3% from last year.
– Condo Apartments: The average price was $395,700, down just 1% from last year.
– Townhouses: The average price was $547,000, up 2% from last year.
In Simple Terms:
The market was steady in December. Single-family homes were the most popular, even though sales dipped a bit from November. Condo and townhouse sales were up compared to last year but also saw a decline from the previous month. There weren’t huge swings in the number of homes for sale, and prices stayed relatively stable.
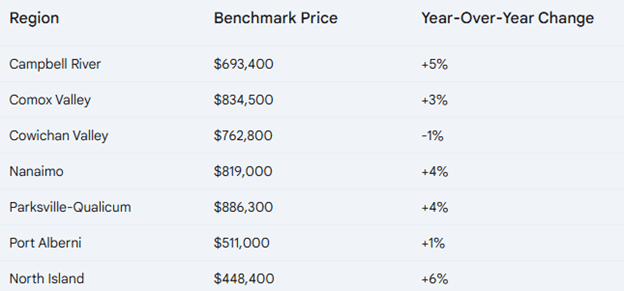
Regional Highlights:
Our 2025 Forecast: Navigating a Dynamic Market
We anticipate continued activity in the housing market throughout 2025, with projected sales of approximately 7,800 units as we saw in 2022. However, it’s essential to acknowledge potential economic influences, such as proposed tariffs, that could impact market trends.
Economic Context:
– Growth Trends: The Canadian economy grew by 1% in the third quarter, falling short of earlier projections.
– Housing Market Impact: The Bank observed increased activity in the housing market, likely fueled by lower borrowing costs.
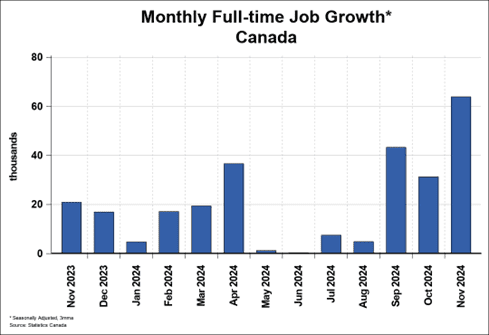
– Employment Challenges: The labor market remains weak, with the unemployment rate rising again in November.
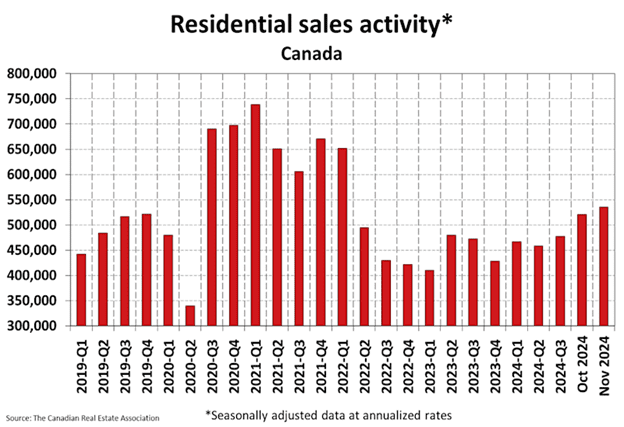
December 2024 saw a dip in home sales activity across Canadian MLS® Systems as the early fall surge of supply was mostly picked over. Sales fell 5.8% from November but remained 13% higher than in May, just before the first interest rate cut in June. Despite the monthly decline, the fourth quarter of 2024 showed a 10% increase in sales over the third quarter, making it one of the strongest quarters for activity in the past 20 years outside of the pandemic period.
The decrease in sales in December likely reflects a shortage of listings rather than a drop in buyer demand. Looking ahead to spring 2025, a significant rise in demand is anticipated as interest rates stabilize and more sellers list their properties.
Key Highlights:
– National home sales decreased by 5.8% month-over-month.
– Actual monthly sales were 19.2% higher than December 2023.
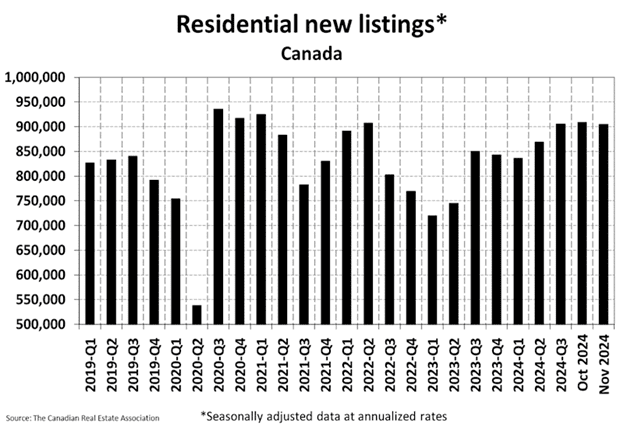
– Newly listed properties dipped 1.7% from November.
– The MLS® Home Price Index rose 0.3% month-over-month and was just 0.2% lower year-over-year.
– The national average sale price increased by 2.5% year-over-year.
New listings continued to decline for the third consecutive month in December, following a spike in September. With fewer homes available over the winter, the housing market may take a brief pause, but the strong rebound seen in the fall offers a preview of what’s expected this spring.
The sales-to-new listings ratio fell slightly to 56.9% in December, down from 59.3% in November but still within the balanced market range of 45% to 65%. There were 128,000 active listings at the end of the year, 7.8% higher than a year ago but below the long-term average of 150,000.
Inventory levels rose slightly to 3.9 months of supply, up from 3.6 months in November, but remain close to seller’s market territory. A seller’s market is typically defined by less than 3.6 months of inventory, while a buyer’s market has more than 6.5 months.
Home prices saw a modest rise for the second consecutive month. The National Composite MLS® Home Price Index increased by 0.3% month-over-month in December. Year-over-year, prices were nearly flat, down just 0.2%—the smallest decline since last April. The national average home price for December 2024 was $676,640, a 2.5% increase from the previous year.
We’re dedicated to providing our clients with the knowledge and guidance needed to navigate the complexities of the real estate market. Whether you’re considering buying or selling, our team of experienced professionals is here to help you achieve your goals.
Here’s how we can assist you:
– Market Expertise: We possess in-depth knowledge of local market trends, neighborhoods, and property values.
Contact Us Today
We encourage you to contact us to discuss your real estate aspirations and how we can help you make informed decisions in this dynamic market.
Stay Connected
Stay tuned for our regular market updates and insights to stay ahead of the curve. We’re committed to empowering you with the information you need to make confident real estate choices.
