

November Market Update (Reflecting October Data)
Prepared for Gillette & Associates
seen in major urban centers. According to VIREB, October recorded 649 total sales across all property types,
down 9% year-over-year. Inventory also tightened slightly, with 3,838 active listings, 4% lower than last year.From our vantage point at Gillette & Associates, this is the hallmark of a market settling into equilibrium.
Prices are holding, buyers are active—but cautious—and well-positioned listings continue to move.
Nanaimo Market Snapshot
Sales Activity
- Single-family homes: 317 sales
- ↓ 8% year-over-year
- ↑ 3% from September
- Condo apartments: 69 sales
- ↓ 13% year-over-year
- ↑ 17% from September
- Row/townhomes: 78 sales
- ↓ 6% year-over-year
- ↓ 1% from September
Inventory
- Single-family: 1,224 active (vs. 1,352 last year)
- Condos: 362 active (vs. 366 last year)
- Row/townhomes: 319 active (vs. 299 last year)
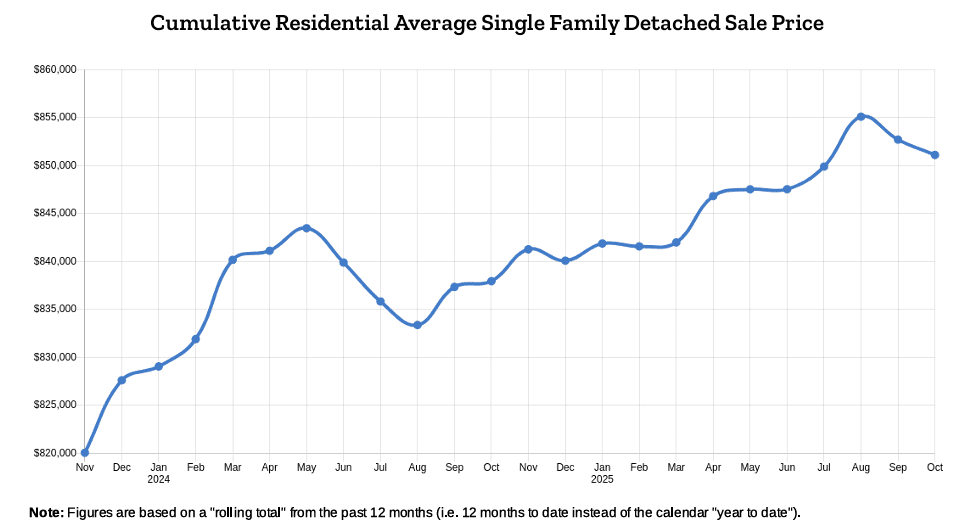
Benchmark Prices
- Single-family: $813,900 (↑ 1% YoY)
- Condos: $411,700 (↑ 4% YoY)
- Townhomes: $542,900 (↓ 1% YoY)
What We’re Seeing Locally
Nanaimo remains one of the most stable pockets on the Island. Homes priced correctly—especially those near
great schools, renovated properties, or strong lifestyle locations—continue to see healthy activity.
Buyers are value-driven but engaged, and the softer fall pace is giving them more time to make decisions
without the high-pressure environment we saw in previous cycles.
Vancouver Island (VIREB Region) Overview
Benchmark Price Changes by Area
- Campbell River: $704,200 (↑ 1% YoY)
- Comox Valley: $859,100 (↑ 3% YoY)
- Cowichan Valley: $803,700 (↑ 5% YoY)
- Nanaimo: $813,900 (↑ 1% YoY)
- Parksivlle–Qualicum: $920,700 (↑ 3% YoY)
- Port Alberni: $521,000 (↑ 4% YoY)
- North Island: $464,600 (↑ 8% YoY)
Across the region, we’re seeing moderate price growth supported by steady demand and manageable supply levels.
The Island continues to outperform when compared to the Mainland, where higher volatility and shifting buyer
sentiment have created more pronounced slowdowns.
Market Tone
VIREB reports roughly six months of inventory, essentially a textbook balanced market. The Bank of
Canada’s rate path feels more stable, and we’re watching this week’s federal budget closely for any housing
measures that could influence demand.
What This Means for Buyers & Sellers
For Buyers
You have time to assess options, negotiate strategically, and take advantage of stable pricing—with less
competition than we typically see entering winter.
For Sellers
Well-presented homes with strong value indicators (location, updates, lifestyle appeal) are still selling
efficiently. Pricing is key; buyers are informed and evaluating homes closely.
Key Charts & Market Relationships
Chart 1 — Detached Sales vs Bank of Canada Policy Rate
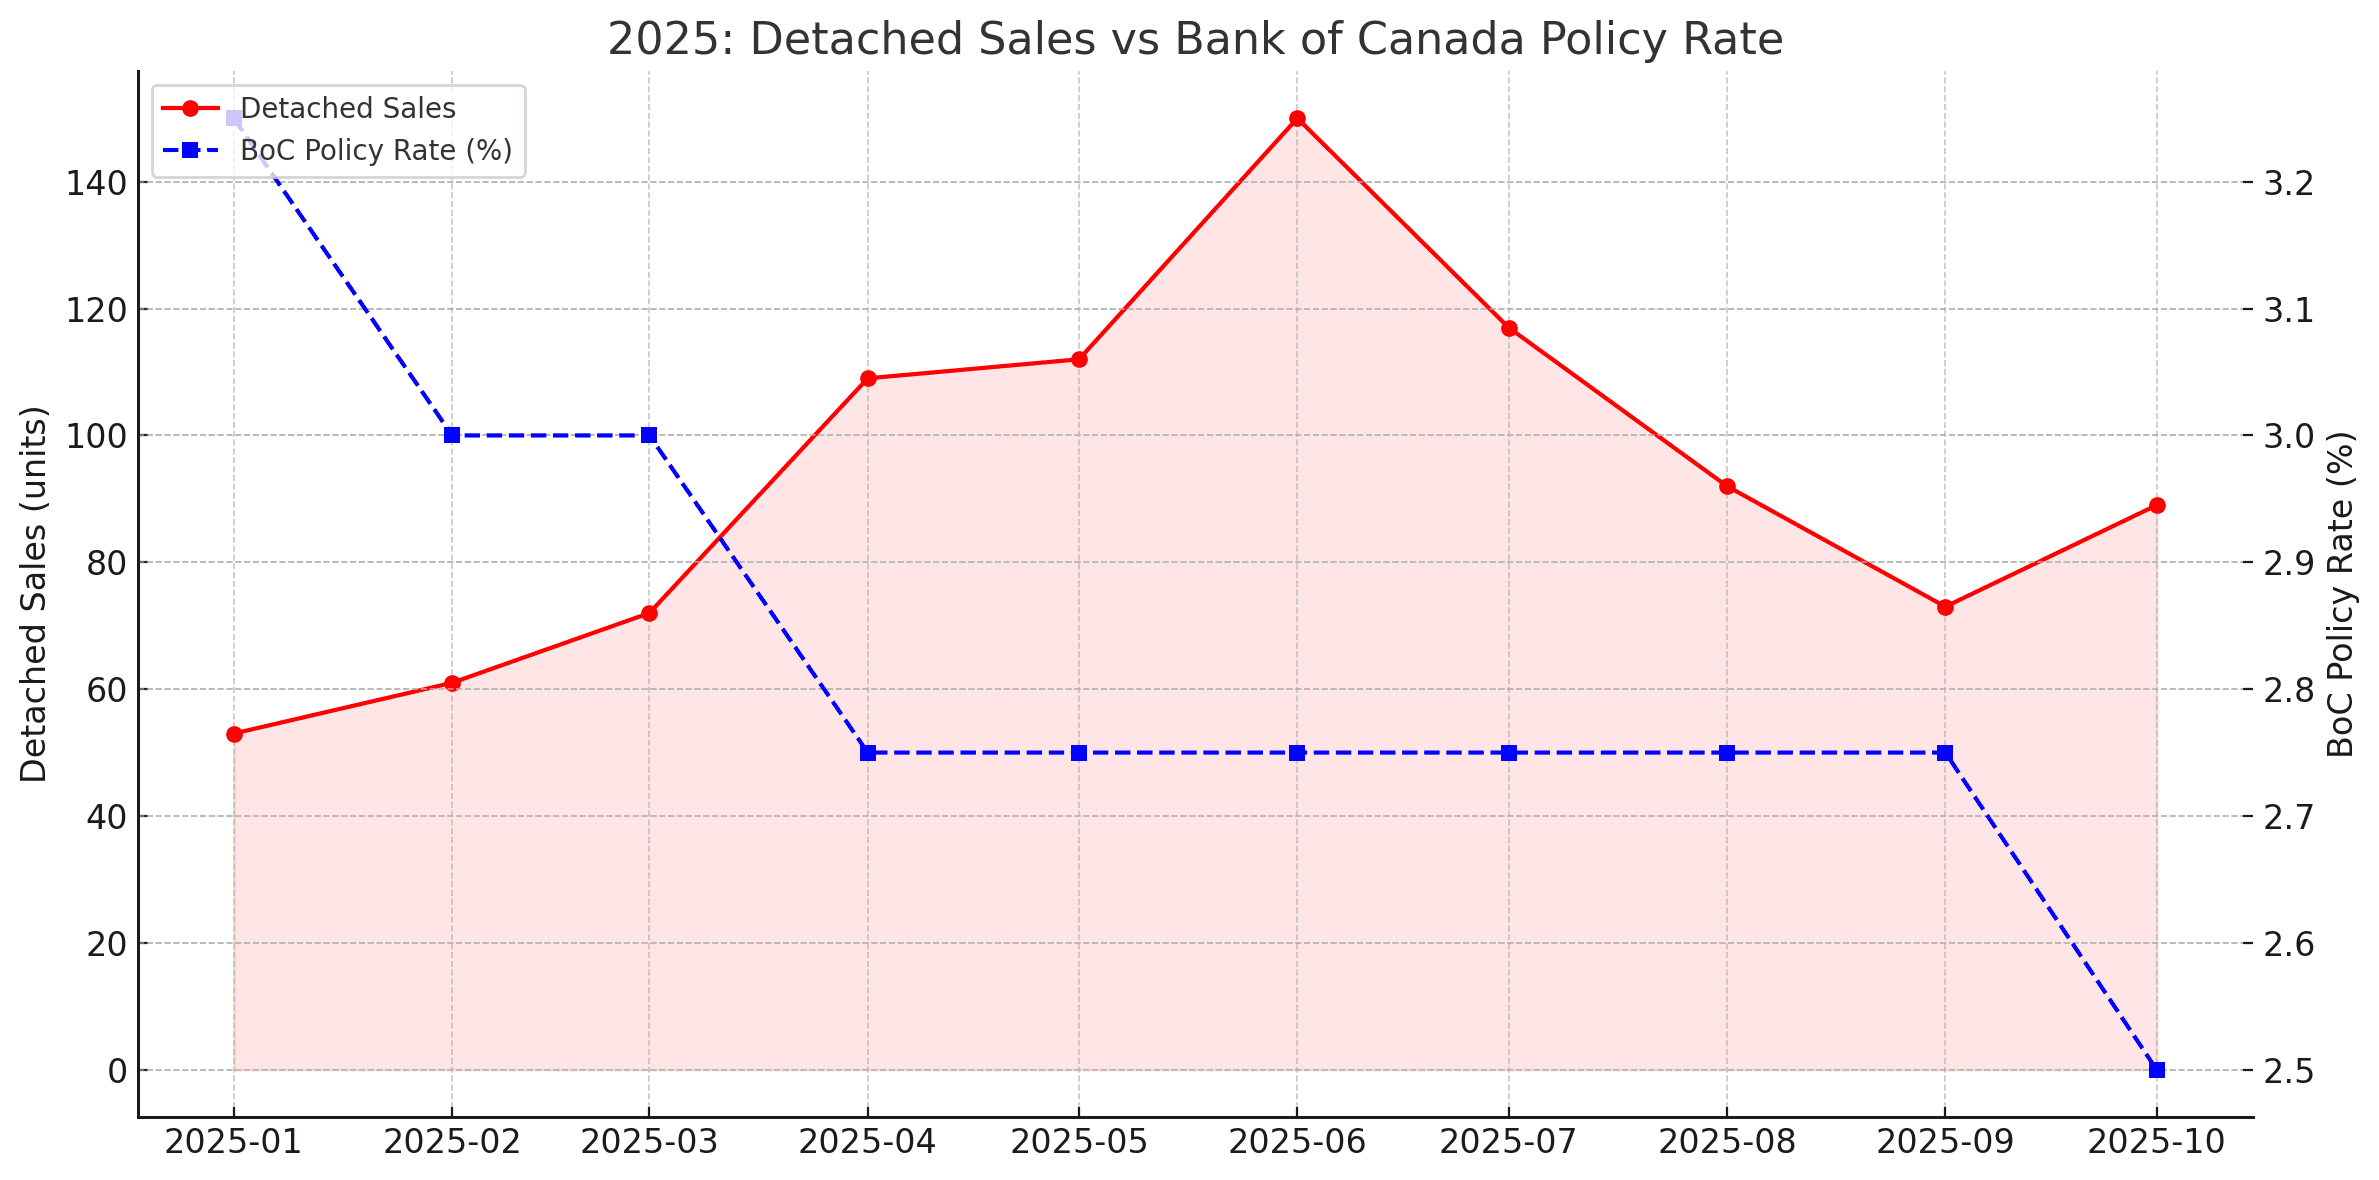
Shows:
- How the Spring → June run-up in sales lines up directly with the March rate cut.
- How sales respond immediately, while rates move in steps.
This chart is excellent for showing clients the real impact of rate policy on local activity.
Chart 2 — Detached Sales vs CFIB Business Barometer (12-Month Outlook)
Shows:
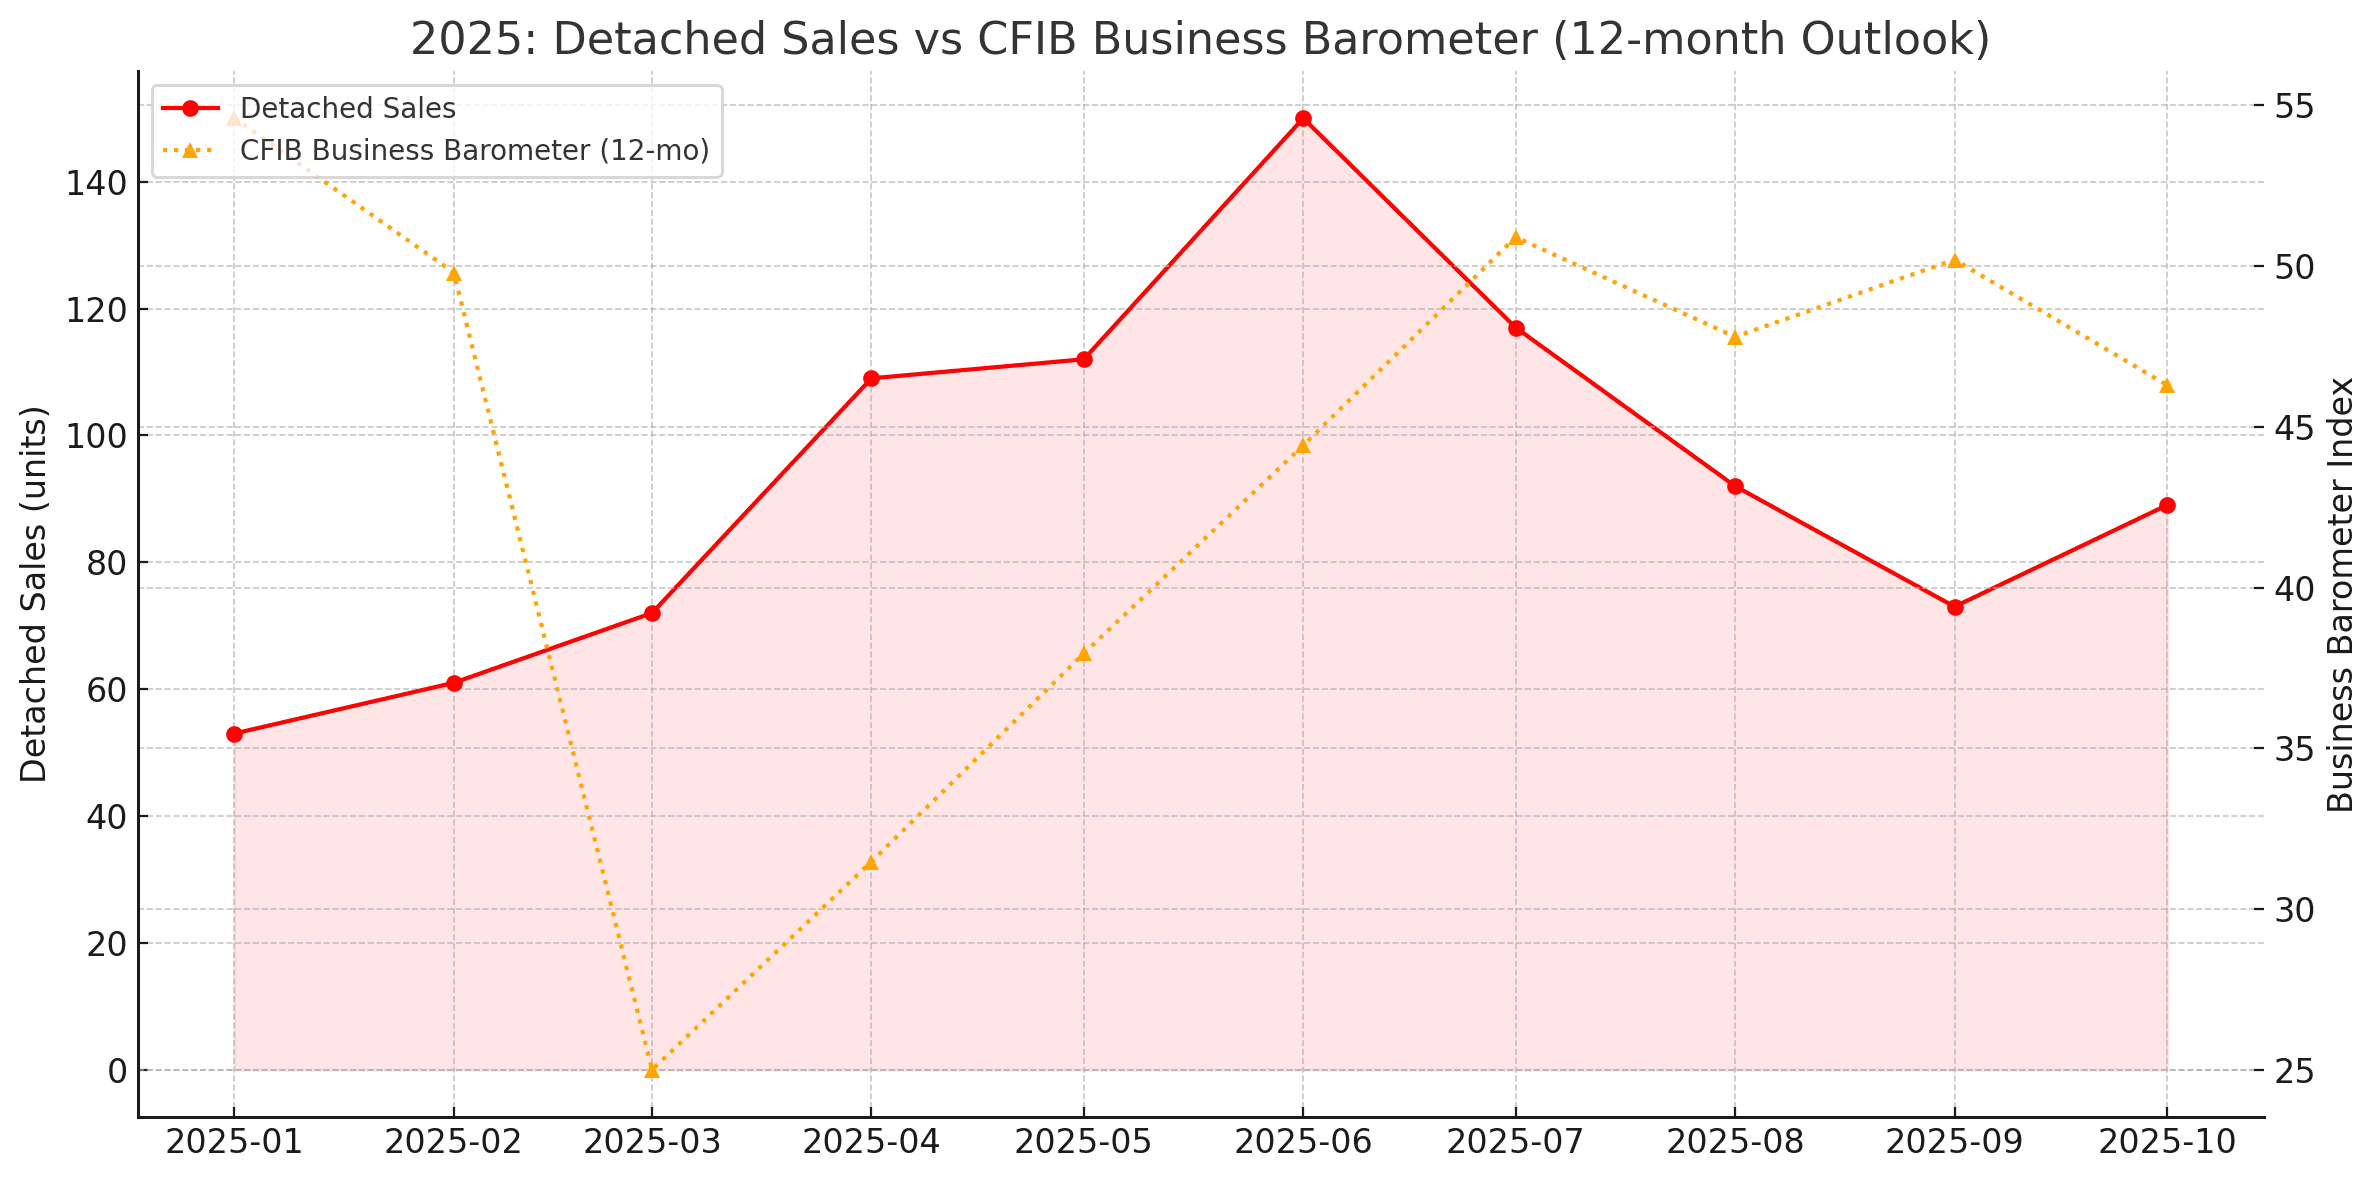
- Business sentiment collapsing in March (25.0).
- A gradual recovery into the spring/summer.
- But sentiment still lags behind sales by approximately two months.
This matches the macro story perfectly:
Sales recover first → businesses regain confidence later.
Chart 3 — Detached Sales vs Consumer Confidence
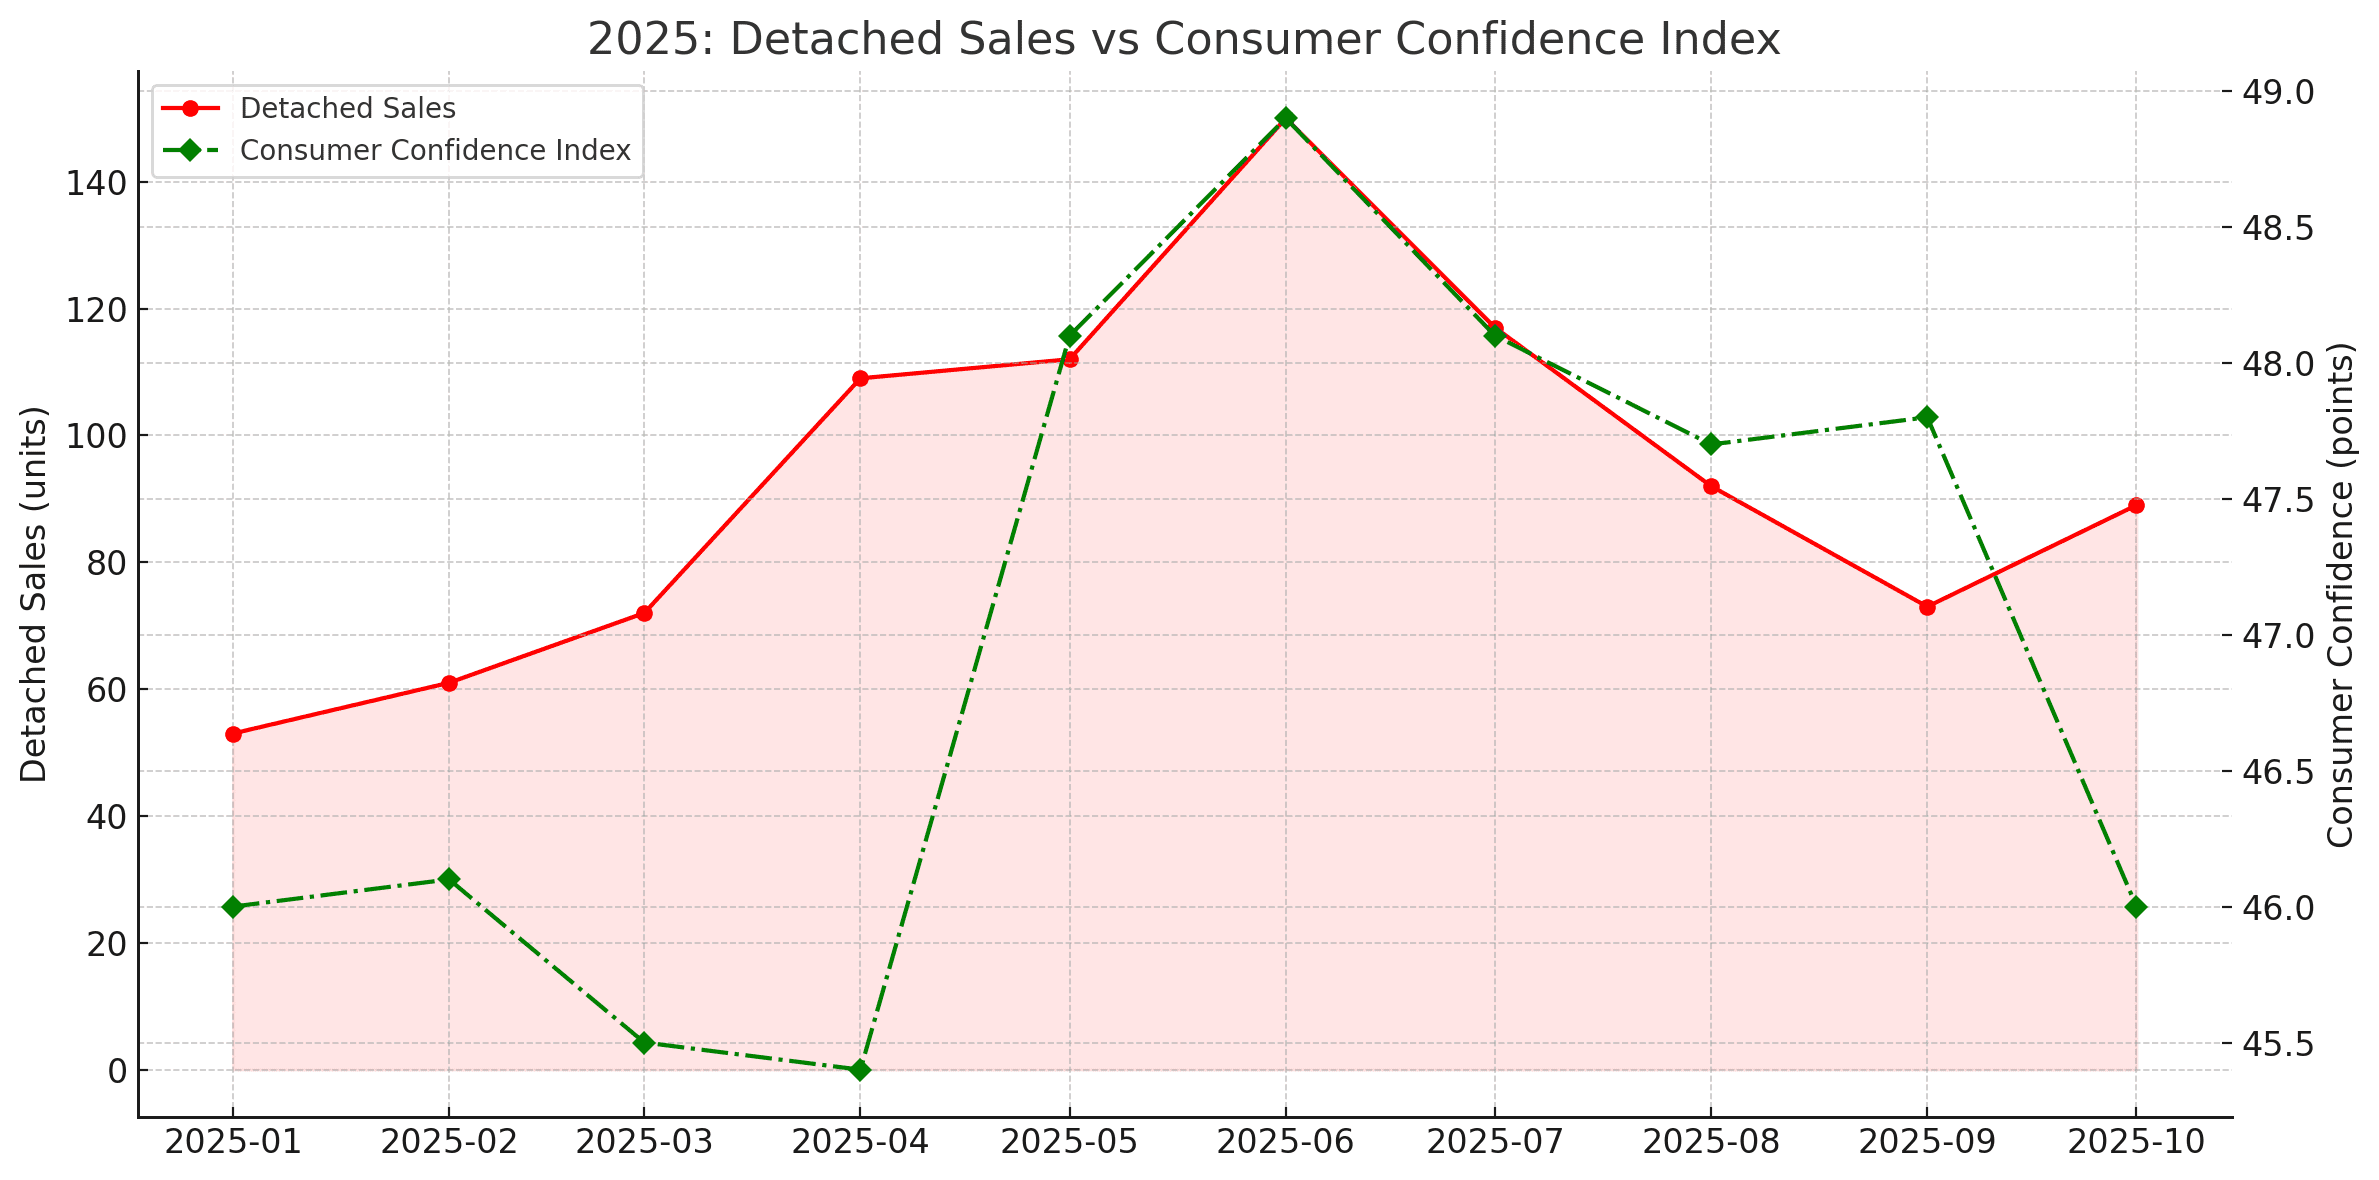
Shows:
- Consumer confidence stays in a narrow band (~45–49).
- It rises slightly heading into the spring and peaks around June—the same window as sales.
- But the movements are much softer than sales (as expected).
Consumer psychology supports the sales trend but does not drive it.
We continue to create leading edge analytics to help you stay ahead of the market. We pride ourselves in market intelligence beyond the standard reports. If you would like to see something specific let is know we have over 500,000 records that we are reviewing with our advanced in house AI system. email in**@***********te.com for your ideas.
