
Nanaimo Real Estate Market Report – November 2025: Assessment vs. Reality & the Floorplans Buyers Want
Market Intelligence
As part of this Nanaimo market report for November 2025, we’re seeing a clear pattern in the single-family segment: buyers are active, but disciplined. They’re prioritizing practical 3–4 bedroom layouts and watching the spread between assessed value and list price closely.
This Nanaimo market report outlines what the latest data shows, how the city compares to the broader VIREB region, and which neighbourhoods and price bands are driving today’s activity.
1. Nanaimo Single-Family Snapshot – November 2025
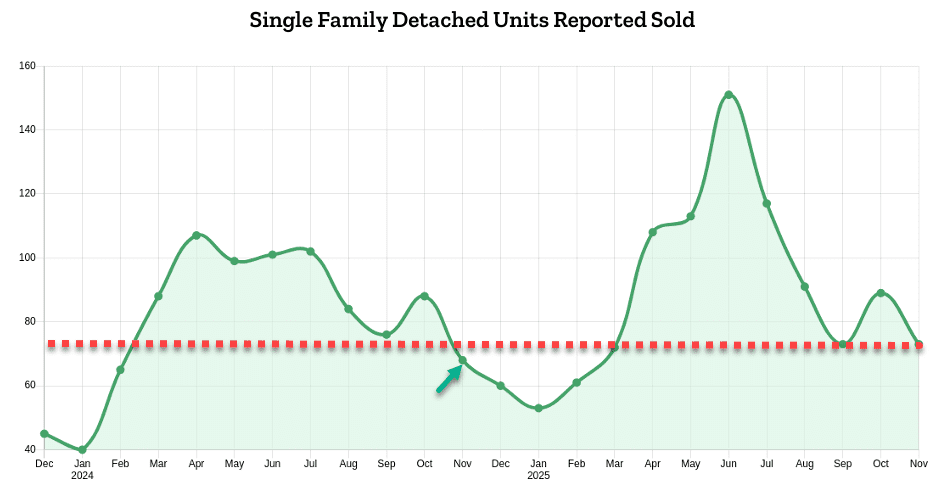
In this Nanaimo market report for November 2025, the single-family segment shows steady and disciplined activity. Based on the latest VIREB Graphstats report, November recorded 95 new single-family detached listings in Nanaimo and 73 completed sales—roughly a 7% increase year-over-year.
The sell-to-list ratio sat around 77%, meaning roughly three out of four new listings that hit the market successfully sold.
Prices remained stable: 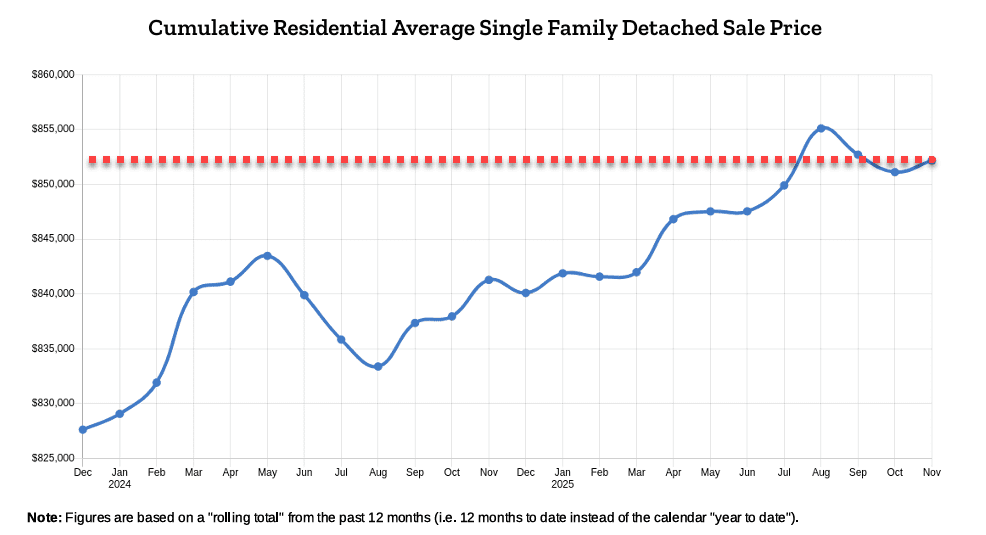
- Average sale price: ~$873,000 (+1.7% YoY)
- Median sale price: ~$810,000 (flat YoY)
- 12-month rolling average: ~$852,000 (moderately higher YoY)
- Days on market: 55 days (up from 50)
Takeaway: Pricing accuracy is key. The market is steady, not correcting, and well-priced homes continue to sell.
2. How Nanaimo Compares to the VIREB Region
- Listings: 335 board-wide (+7.7% YoY)
- Sales: 259 (-1.2% YoY)
- Average price: ~$843,000 (+6.9% YoY)
- Median price: ~$785,000
- Days on market: ~52 (slightly improved YoY)
Nanaimo is outperforming the region in sales momentum while maintaining balanced, sustainable price growth—ideal conditions for sellers.
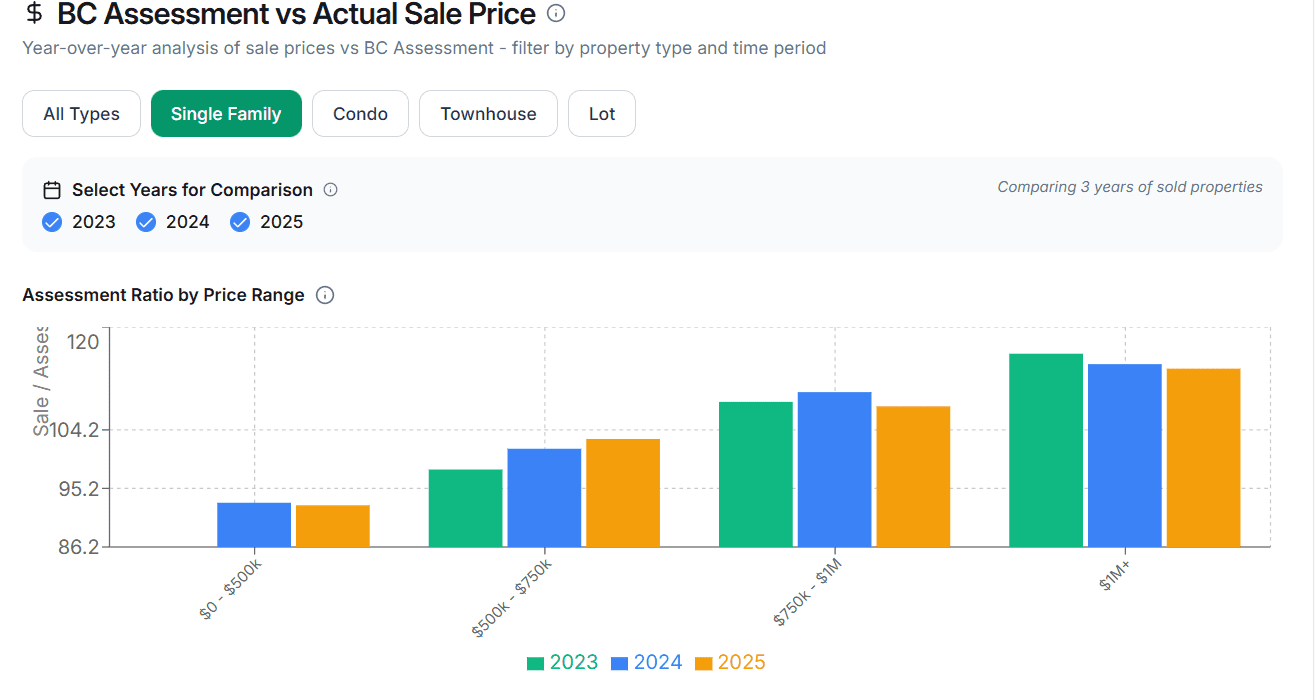
3. Assessment vs List vs Sold – Where the Market Is Clearing
Active Listings
- Avg assessed value: ~$922K
- Avg list price: ~$1.13M
- Premium: ~30% above assessment
Pending Sales
- Avg assessed value: ~$870K
- Avg list price: ~$925K
- Premium: ~10% above assessment
Recent Closed Sales (Last 30 Days)
- Avg assessed value: ~$781K
- Avg list price: ~$783K
- Premium: ~0–1% above assessment
- List-to-sell ratio: 100% for all successful sales
What this shows:
- Buyers are rejecting aggressive 20–30% markups over assessment.
- Homes priced near assessment—or up to ~10% above—have the highest success rate.
- Correct pricing translates directly to faster sales and fewer reductions.
4. Floorplans & Price Bands: What Buyers Actually Bought
Most Purchased Floorplan Types (Last 30 Days)
Top performer: Ground Level Entry with Main Up
- 5 of the 15 most recent sales
- 32 of 101 pending deals
Other strong performers:
- Main Level Entry + Lower Level – 3 sales, 18 pending
- Main Level Entry + Upper Level – 3 sales, 15 pending
- Ranchers – 4 sales, 12 pending
These homes are predominantly 3–4 bedrooms, with 3-bedroom layouts dominating the recent closed sales and 4-bedroom layouts leading pending activity.
Price Segments
Under $800K – $1M: This is where the majority of sales and pending deals are concentrated.
Above $1.25M: Inventory far exceeds accepted offers.
- 79 active listings
- 13 pending
- 1 recent sale
Conclusion: A two-speed market—competitive below $1M, slower and inventory-heavy above $1.25M.
5. Neighbourhood Standouts
Volume Leaders (Last 30 Days)
- North Nanaimo: 4 recent sales, 13 pending
- Cedar: 3 recent sales, strong value-based activity
- South Nanaimo, Central Nanaimo, Departure Bay, Chase River – all showing strong pending pipelines
High-Absorption Areas
- North Jingle Pot: Pendings ≈ actives (~100% absorption)
- Chase River: ~90% absorption
- Pleasant Valley: ~66% absorption
- Central Nanaimo, Departure Bay, Diver Lake, Uplands, South Nanaimo: Mid-40% absorption
Year-to-Date (Jan–Nov)
- North Nanaimo: 194 SFD sales
- South Nanaimo: 120
- Departure Bay: 97
- University District: 94
- Uplands: 62

The current 30-day snapshot supports these long-term trends: established family neighborhoods continue to dominate activity.
6. VIREB Region: Detached vs Condos & Townhomes
Detached homes remain the market anchor across Vancouver Island, while attached segments show more sensitivity to affordability and rate dynamics.
Condos (Nanaimo – November)
- Sales down ~43% YoY
- Prices down ~10–11%
- Days on market improved
Townhomes (Nanaimo – November)
- Slight dip in sales
- Average prices up ~11%
- Days on market extended from 40 to 67
Across the wider board area, both condos and townhomes show lower volumes and slightly softer pricing compared to last year.
7. What This Means for Buyers and Sellers
For Sellers
- Expect committed buyers, but strong price discipline.
- Homes priced at assessment or up to ~10% above are in the most competitive zone.
- Overpricing 20–30% typically results in extended days on market and reductions.
- Main-level-entry 3–4 bedroom homes remain top performers.
For Buyers
- Stronger negotiating power above $1.25M; less leverage under $1M.
- Assessment is once again a reliable benchmark.
- In high-absorption pockets like North Jingle Pot, Chase River, Pleasant Valley, Central Nanaimo and Departure Bay, quick decisions matter.
If you’d like a neighbourhood-specific breakdown for your property or a shortlist tailored to your price band and needs, we can prepare a custom analysis anytime. Our in-house system evaluates over 8 million data points across 10+ years to deliver precise forecasting. This Nanaimo market report for November 2025 is just the starting point—your home or search area deserves a deeper, custom-level insight.