
Nanaimo Market Report — Single Family (60-Day Snapshot)
A data-driven look at Nanaimo single-family homes using our 60-day window, plus BC and Canada context to explain the “why behind the numbers.”
1) Nanaimo — Single Family Homes
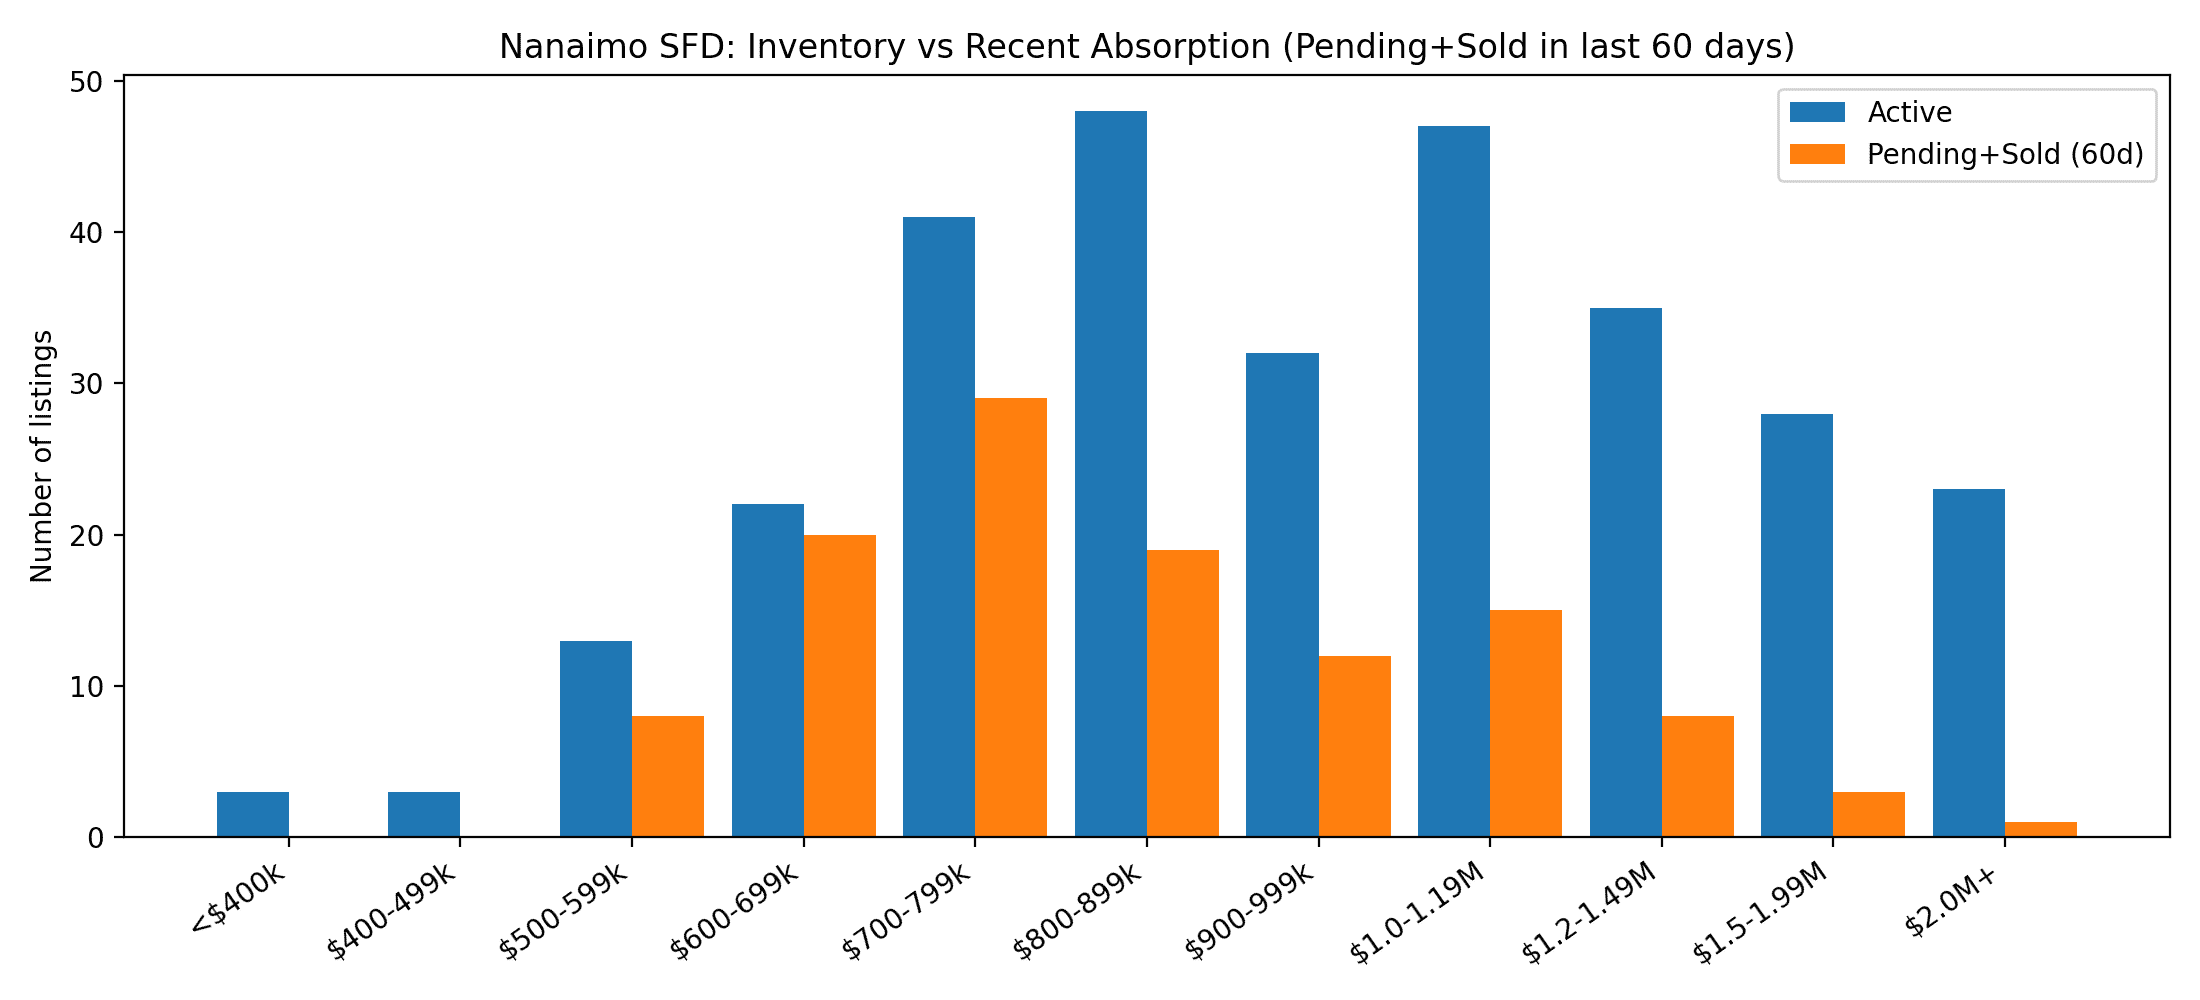
Nanaimo is moving — but selectively. The market is absorbing well-positioned homes, while aspirational pricing is showing up as longer days on market and price reductions.
295
76
39
~5.1
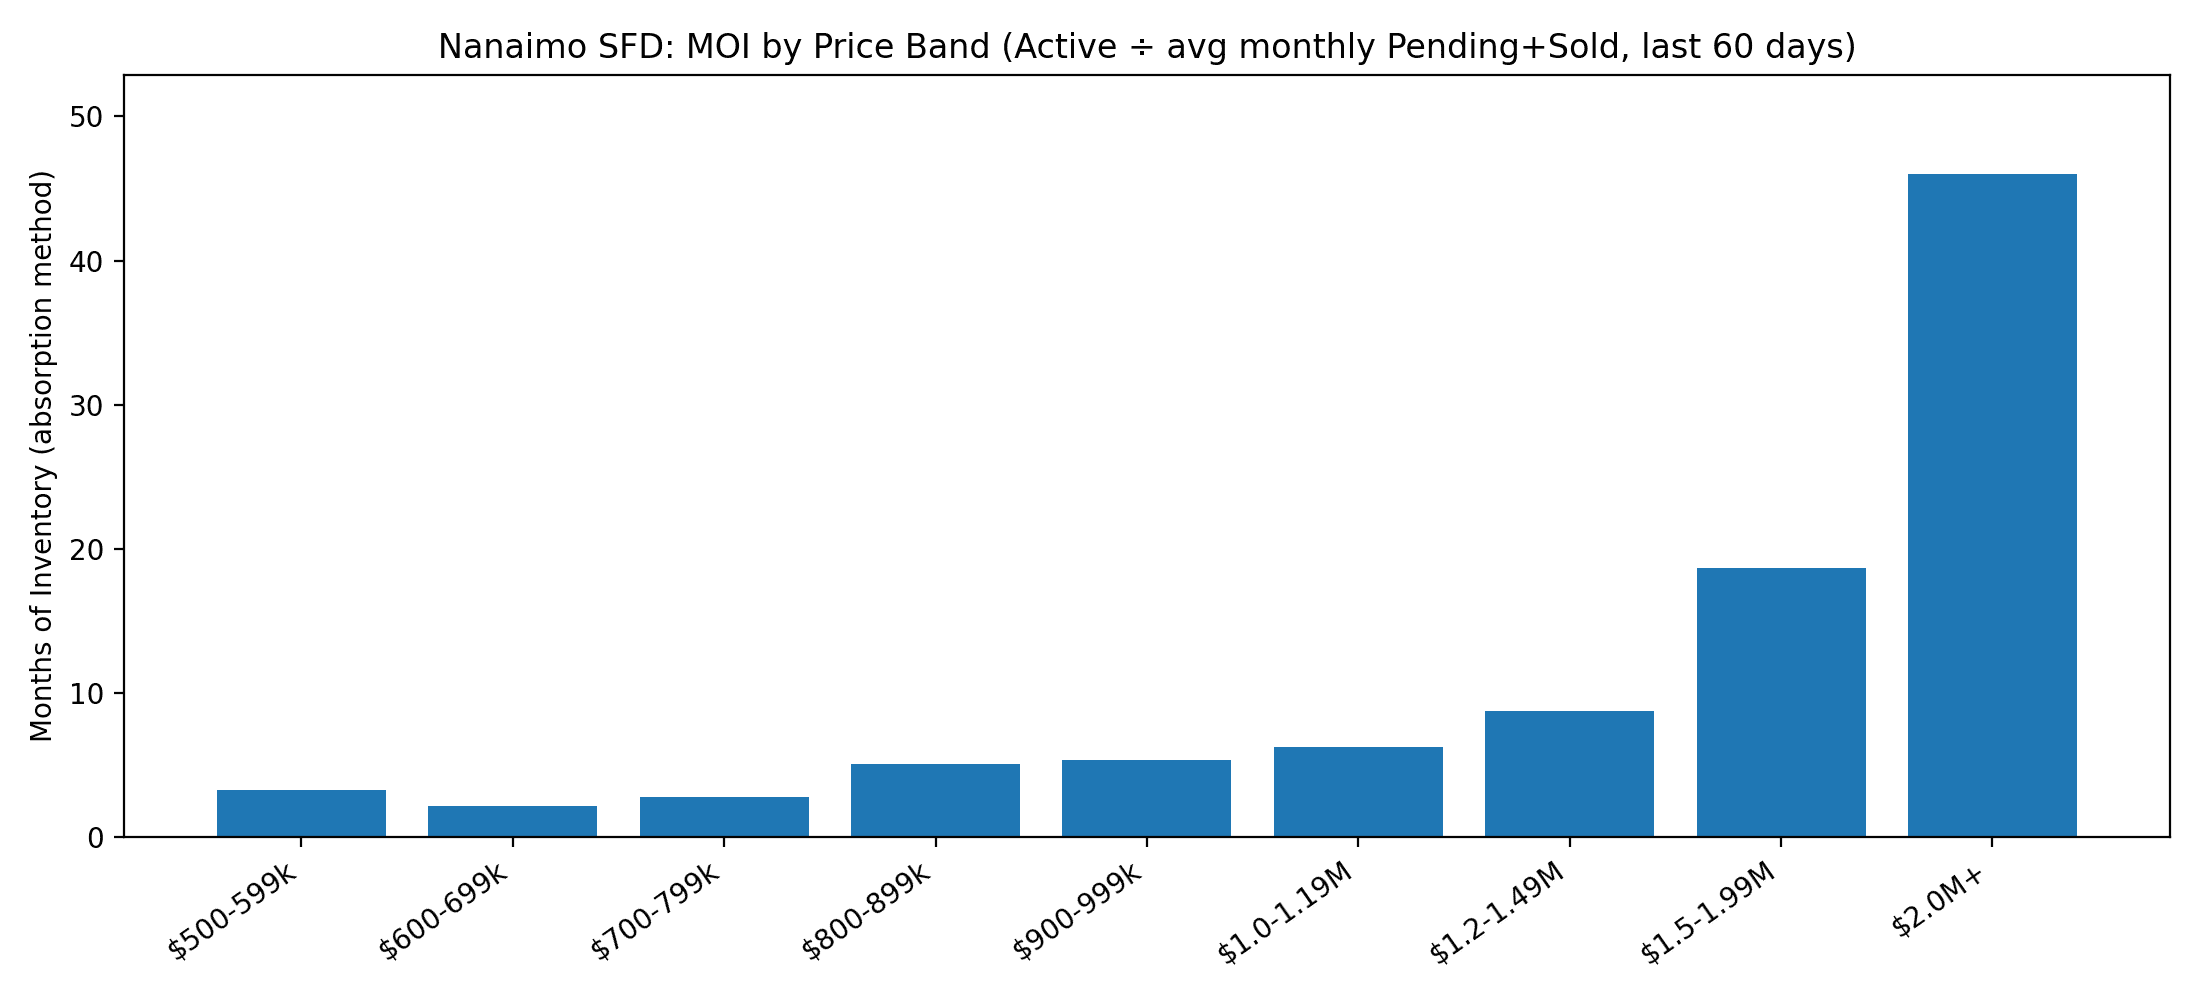
Where the market is tight
$600k–$800k is the most competitive lane — strongest absorption and quickest decision-making when the home is priced right.
Where the market is slower
Above $1M (especially $1.5M+) inventory stacks faster — buyers compare harder and negotiate more.
Floorplans drawing offers
- Split Entry (fast absorption)
- Ground Level Entry (Main Up) (strong demand)
- Ranchers (consistent buyer pull)
- Main Level + Lower Level (higher volume; slightly longer pace)
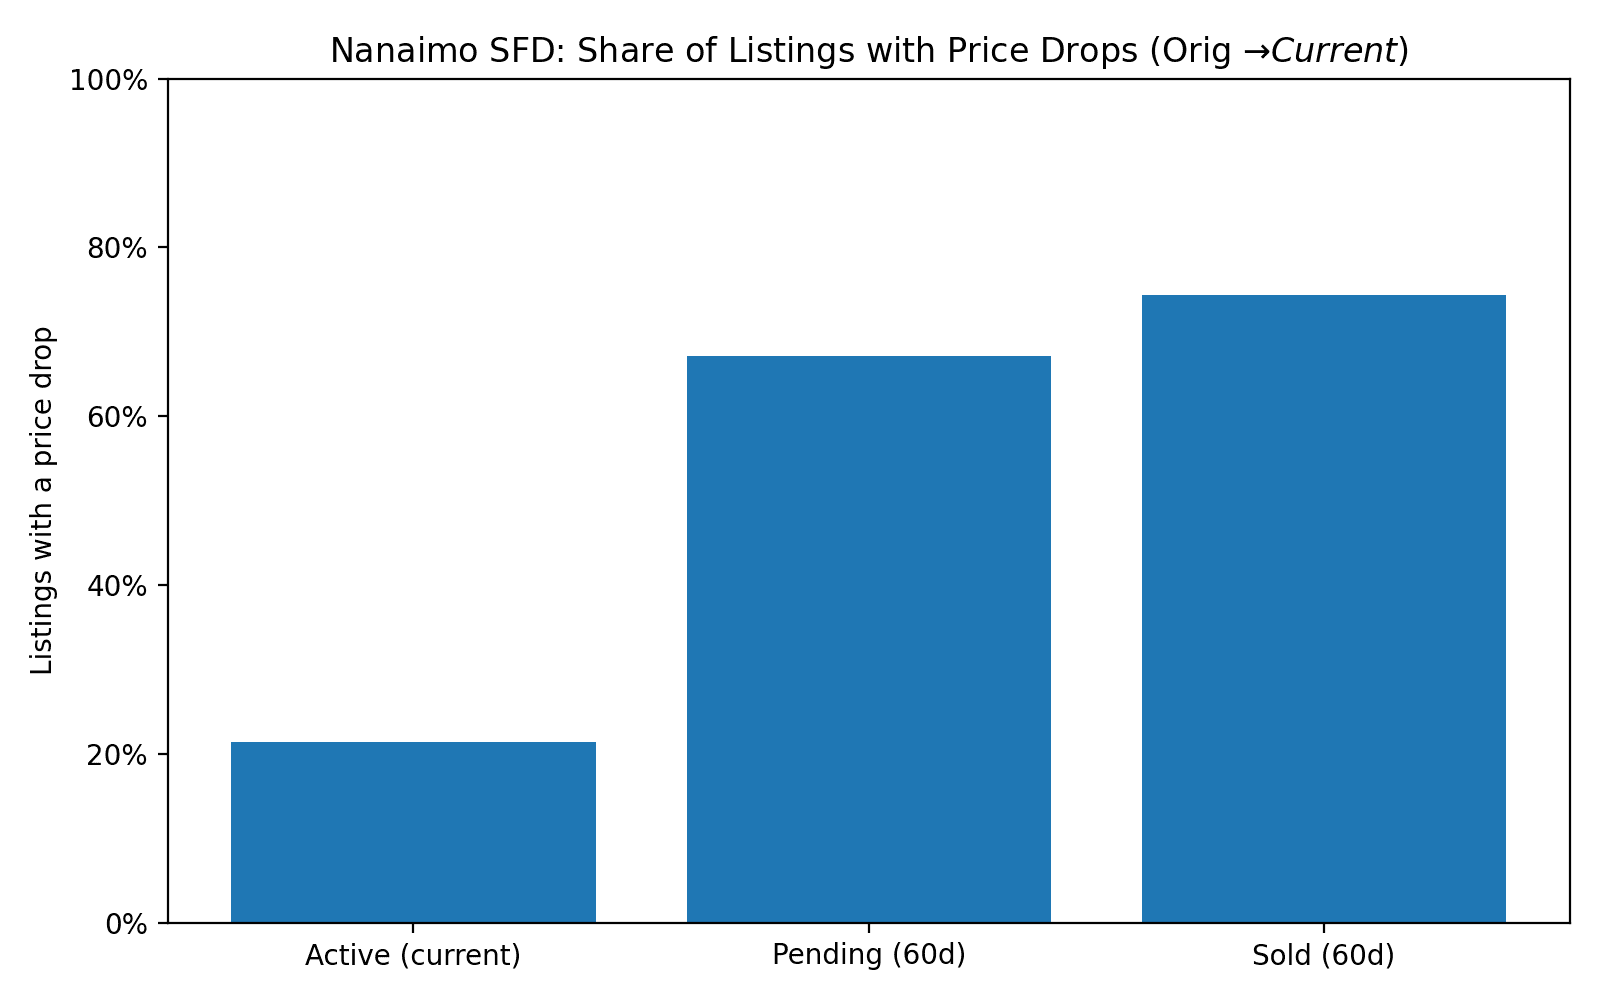
Negotiation reality
- Price drops are common before a listing finds its buyer (often a 3–5% correction).
- Absorbed homes are aligning closer to assessment than many current actives.
Assessment vs list vs absorbed pricing
| Metric (median) | What it shows |
|---|---|
| Original List ÷ Assessment (sold set): ~1.044× | Sold homes were typically listed ~4.4% above assessment. |
| Sold ÷ Assessment: ~1.003× | Sales clustered near assessment (in this slice). |
| Active List ÷ Assessment: ~1.099× | Actives sit ~10% above assessment — where friction builds. |
Gillette & Associates view: absorbed homes are aligning closer to assessment, while many actives are still priced above that lane. That gap typically resolves through time or modest reductions.
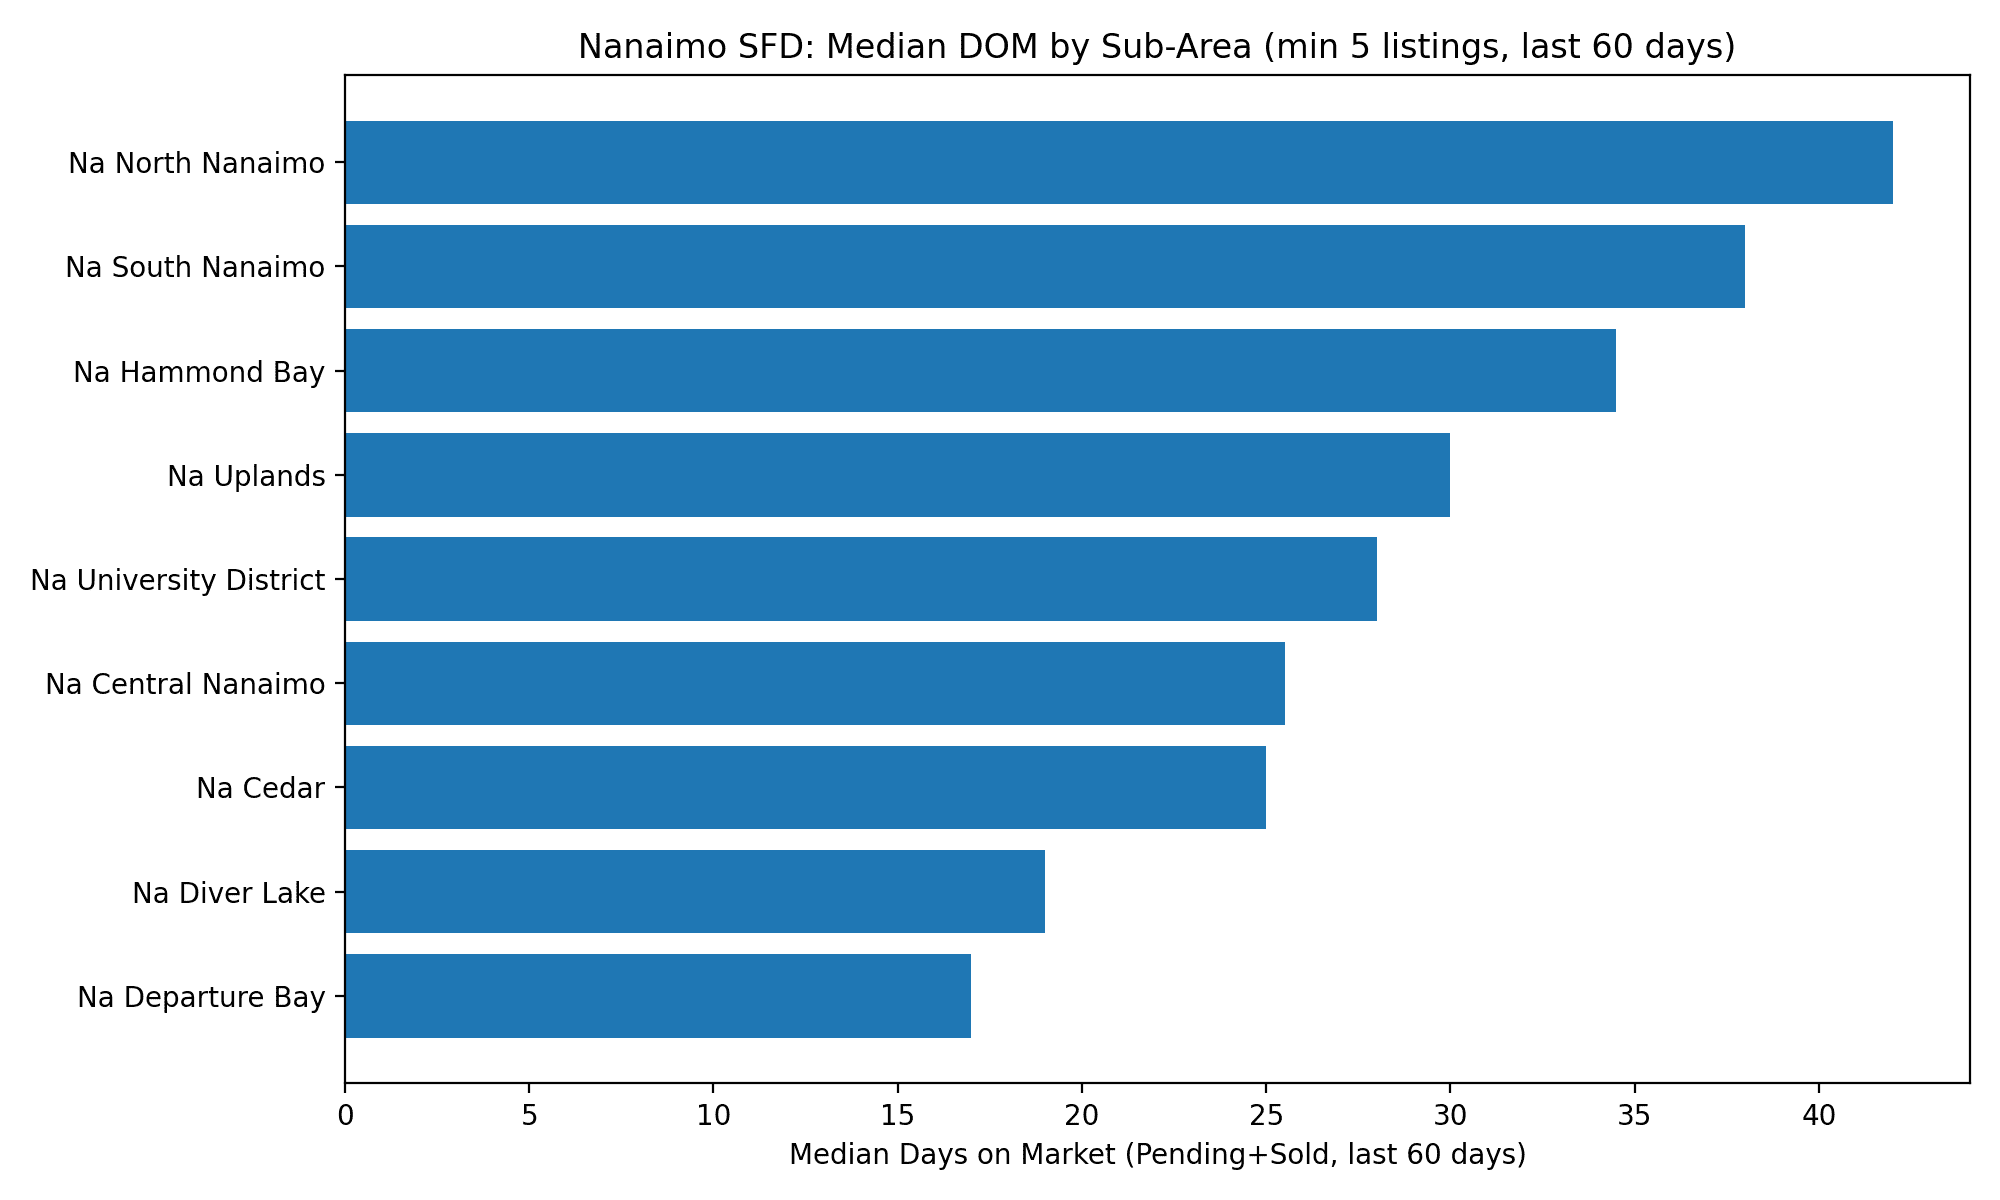
Charts: Nanaimo Single Family (60-day window)
We’ve included only the charts you want shown in this post.
2) British Columbia — Provincial Context
BC started 2026 with softer sales and higher inventory — a backdrop that supports Nanaimo’s selective pattern.
BC Sales (Jan 2026)
3,314 MLS® sales
Down 22.9% year-over-year.
BC Average Price
$924,239
Down 1.9% year-over-year.
BC Active Listings
32,626
Up 5.6% year-over-year.
3) Canada — National Context
Nationally, sales softened while new listings rose — the market becomes more rational and comparison-driven.
Canada Sales (Jan 2026)
-5.8% month-over-month
-16.2% vs Jan 2025 (not seasonally adjusted)
New Listings (Jan 2026)
+7.3% month-over-month
More selection → more comparison shopping
Market Balance
~4.9 months of inventory
45% sales-to-new listings ratio
Source: CREA Stats Dashboard
